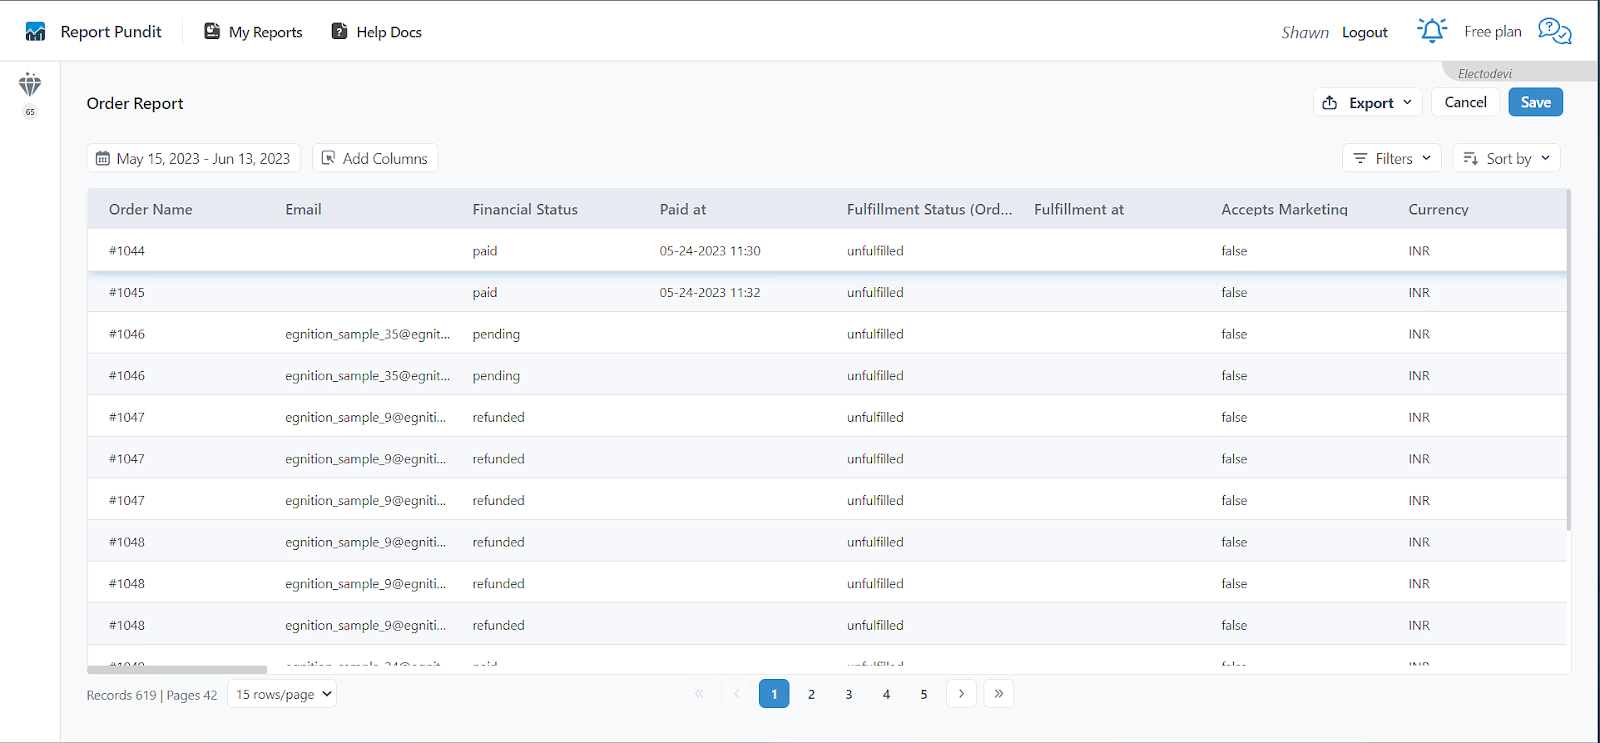
# Welcome to Report Pundit Documentation
This area helps educate, train, and assist customers with the use of our Report Pundit service. You can browse the sections, search by keyword, or return home to ReportPundit.com
Becoming an expert at Report Pundit is a fairly straightforward process:
1. Review the topics in the left-hand sidebar
* [x] *We suggest you start your learning journey with the* [*Basics*](/getting-started)*.*
2. To better understand custom fields and detailed features, dive into our [Knowledge Base](broken://pages/-MVYLQ_YgEiUEG7E0qvl)
3. Watch videos and read documentation as desired.
4. Check our commonly asked questions in our [FAQs](/faq/reports) Section.
5. Search by keyword if you know what you're looking for.

Once you're ready, it's time to :unlock: [unlock the power](https://apps.shopify.com/report-pundit) of your storefront data!
{% hint style="success" %}
All the pictures and videos used for demonstration has been taken from the Developer's account. **Your privacy is secured!** :closed\_lock\_with\_key:
{% endhint %}
### :book: Table of Contents
{% content-ref url="/pages/-M\_5WR1EPduH9L5yH5zP" %}
[Getting Started](/getting-started)
{% endcontent-ref %}
{% content-ref url="/pages/-MVYLQ\_XBiH11M49Ob29" %}
[Knowledge Base](/knowledge-base/report-creation)
{% endcontent-ref %}
{% content-ref url="/pages/-MVYLTw7K-\_ub8K50beT" %}
[FAQ](/faq/reports)
{% endcontent-ref %}
{% content-ref url="/pages/-MVYLZ28HEBbeOT-2YPS" %}
[Guides](/changelog/changelog)
{% endcontent-ref %}
{% hint style="info" %} Click [HERE](https://reportpundit.com) to return to the [ReportPundit.com homepage](https://reportpundit.com).
{% endhint %}
# Getting Started
Report Pundit is designed to make Shopify reporting intuitive and simple. This page helps you get familiar with the user interface by exploring it in detail.
## :scooter:Navigating Report Pundit
Click on a tab below to learn more about the feature.
{% content-ref url="/pages/wgyVrtVWKRTR4ZSJM61G" %}
[Walkthrough](/getting-started/walkthrough)
{% endcontent-ref %}
{% content-ref url="/pages/-M\_JThBNPeouSIGIxvu-" %}
[Navigation Panel](/getting-started/navigation-bar)
{% endcontent-ref %}
{% content-ref url="/pages/1B3Asm9mHP63YpbTrESp" %}
[Home](/getting-started/home)
{% endcontent-ref %}
{% content-ref url="/pages/-M\_JTZ1ITH-z14rRe-Yt" %}
[Library](/getting-started/reports-dashboard)
{% endcontent-ref %}
{% content-ref url="/pages/JiAW3ErqZS6WYfOrH011" %}
[My Reports](/getting-started/my-reports)
{% endcontent-ref %}
{% content-ref url="/pages/-M\_JTm39zht7q8qhJvci" %}
[Getting Started - Schedules](/getting-started/schedules)
{% endcontent-ref %}
{% content-ref url="/pages/LzHzJJz365hnd68lB4kE" %}
[User Management](/getting-started/settings/user-management)
{% endcontent-ref %}
{% content-ref url="/pages/-MaCdOMDBjK2JZuOP41i" %}
[Broken mention](broken://pages/-MaCdOMDBjK2JZuOP41i)
{% endcontent-ref %}
{% content-ref url="/pages/-MdGWjP\_r5cgDppUrkyK" %}
[Global - Settings](/getting-started/settings)
{% endcontent-ref %}
{% content-ref url="/pages/-MchF7pA0ClY5MShRxnL" %}
[How to Create a Custom Report and Auto-Schedule It](/getting-started/create-a-customized-report-and-auto-schedule-it)
{% endcontent-ref %}
# Walkthrough
Watch this video to learn about Report Pundit's features and how to use them.
{% embed url="" %}
Report Pundit Onboarding Video
{% endembed %}
# Navigation Panel
The navigation panel instantly transports you to different sections of Report Pundit. This page details how to use it.

*(Click on a title below to go its dedicated help documentation page)*
### [Home](/getting-started/home)
Shows a summary of your store’s important data fields and activities. Displayed sections include:
* Highlights of **Total Sales, Order Count, Refunds,** and **Repeat Customers**.
* **My Favorite Reports**, containing reports that you’ve selected as your favorites.
* **Latest Activities**, where you can view your recent activities performed in the app.
* **Popular Integrations**, showing the most popular third-party apps integrated with Report Pundit by the seller community. You can also see which of those apps you’re connected to right there.
* **Popular Reports**, a list of all the report types popular with our customers.
### [Library](/getting-started/reports-dashboard)
Contains **report templates** (pre-made reports) to help you create reports quickly and easily. You can choose from **100+ templates** covering important categories like **Sales, Orders, Tax, Inventory, and Shopify Payout**, among others.
### [My Reports](/getting-started/my-reports)
This section shows all the reports you’ve created and saved. Includes both template-based and custom reports.
### ****[**Schedules**](/getting-started/schedules)
Shows reports you have scheduled for sharing, with details like **frequency, output type, date and time of creation, next run, and actions**. Also shows a history of your **previously scheduled reports** with all relevant information.
### [Integrations](/knowledge-base/app-integrations)
Shows the available **third-party applications** you can integrate with your Report Pundit account, including the ones presently integrated. **Highlights** give the **Most Popular** and **Recently Added** ones. You can also view the apps sorted into **Categories** like **Marketing, Payout, Subscription, Shipping, and Returns**.
### [**Settings**](/getting-started/settings)
Has all the options you need to **control** your Report Pundit account. You can manage B**asic Account Information, Data Sync Options, Report Formatting, Re-Authorization for Shopify accounts, FTP, Custom Email,** and more.
### ****[**Help Docs**](/)
The link to Report Pundit website’s **Help** section with **documentation** and **video tutorials** to get you familiarized with the app.
{% hint style="info" %}
If you feel we have missed something that you were looking for, feel free to [**contact us**](https://www.reportpundit.com/contact-us)**.**
{% endhint %}
# Home
The Home page gives an overview of your account status and activities. You can also see information about integrations and popular reports.
## :pager:Highlights
Quickly view your store performance over the last 30 days in neatly arranged tabs. You can even see when the data was last refreshed.

## :heart\_decoration:My Favorite Reports
Shows the list of reports you've marked as **Favorite.**

### :clipboard: Steps to add a report to 'My Favorite Reports'
* Go to the "**My Reports**" page.
* Click on the **Favorite Icon** to add the report to '**My Favorite Reports**'.
*That's it! You've successfully added a report to 'My Favorite Reports".*
## :scroll:Latest Activities
Check out what activities you've performed in your Report Pundit account in the recent past. The list is arranged in descending order, starting with your latest activity.
## :handshake:Popular Integrations
Find out which third-party app integration is trending among Report Pundit customers. Also see if your account is connected to any of the apps. Click on **View More** at the bottom to reach the **Integrations** page.
## :boom:Popular Reports
All the pre-made report types that are currently loved by our customers. The **View All Templates** button at the bottom of the panel leads to our **Library** page with the available templates.
{% hint style="success" %}
Stay updated about your store via your Home page with real-time information.
{% endhint %}
# Library
The Library is where you find the 100+ report templates. Find out more about our app's landing page below.
#### 1️⃣ **Search for Report Templates**
Search for any report you want by entering its name here.
**2️⃣Time Stamp of Last Sync**
This is the date and time when your Report Pundit last synchronized with your Shopify store records.
**3️⃣Report Templates (Pre-Created Reports)**
These sections contain **pre-created reports** by category - **Sales, Products, Inventory, Tax, Shopify Payout**, etc.
#### 4️⃣Create Custom Report
Click on '**Create Custom Report**' to create a **customized report** based on your specific requirements.
## How to Create a Report using Report Templates?
Let's use **Inventory Reports** as an example.
The **Inventory** **Reports** tab has 11 pre-created reports, as shown in the image above. To generate the Inventory Status report, for example, do the following:
* Click on **Inventory Status**. You'll be taken to a new page where the report will load. Give it a few moments and you'll have your report ready.
* Once the report opens, you can save it by clicking on **Save**.
The saved report can be found in **'My Reports'** shown in the [Navigation Panel](/getting-started/navigation-bar).
{% hint style="info" %}
To learn more about reports and their features, click[ here](/knowledge-base/report-creation)
{% endhint %}
# Custom Properties Report
Use Custom Property Reports to pull rich, non-standard data from Shopify—like line-item properties, metafields, note attributes, and other attributes—across Orders, Products & Variants, and Customers.
### What you can report on
* Orders
* Line-item properties
* Order note attributes
* Order metafields
* Product metafields
* Variant metafields
* Customers
* Customer metafields
Tip: If a third-party app writes custom data to Shopify metafields, attributes, or line-item properties, you can include it in these reports.
***
#### Before you start
* You’ll need access to the Reports Library and permission to view the relevant Shopify objects.
* Ensure your store data is synced. If not, you’ll see a Sync now prompt when you try to add properties (see Step 5) or sync from settings > data sync options.
***
#### Create or open a Custom Property Report
1. Go to Library → Custom Property\
Open any pre-created report in the Custom Property category. We include a few related fields by default to get you started.
2. Open the Custom Property panel\
In the report header, the Custom Property button will be highlighted. Click it to add property fields.
3. Select the Property Type\
Choose where the custom data lives, e.g.:
* Order metafield
* Order note attribute
* Line-item property
* Product metafield
* Variant metafield
* Customer metafield
4. Choose the Key and Column name
* Key: the exact property/metafield key (e.g., engraving\_text, custom.gift\_message).
* Column name: how it will appear in the report.
5. Handle data sync (if prompted)
If any source isn’t synced yet, you’ll see a Sync now link. Click it to start syncing.
* Syncs typically complete in a few minutes.
* Once complete, return to the report and continue adding properties.
6. Save the configuration\
After all required sections are filled (Property Type + Key + Column name), click Save. The field is added to your report.
7. Verify the data\
Check a few rows to confirm values are populating as expected. Add, reorder, or remove fields as needed.
***
Examples
* Gift message on order line items
* Property Type: Line-item property
* Key: gift\_message
* Column name: Gift Message
* Personalization text (variant)
* Property Type: Variant metafield
* Key: custom.personalization\_text
* Column name: Personalization
***
Troubleshooting
* I don’t see values for a field.
* Confirm you selected the right Property Type (e.g., product vs. variant metafield).
* Verify the key is correct (namespace.key for metafields).
* Make sure the data exists in Shopify (check a known record in admin).
* If prompted earlier, ensure the sync finished, then refresh the report.
* “Sync now” keeps appearing.
* Start the sync from the prompt and give it a few minutes.
* If it persists, re-open the report and try again. If still stuck, contact support with the object type and key.
***
## FAQ
Can I add multiple custom properties at once?\
A: Yes. Repeat the add-field steps for each key you want in the report.
Do third-party app fields show up automatically?\
A: If the app writes to Shopify (metafields, attributes, line-item properties), they’ll appear after a successful sync.
What if my app stores data outside Shopify?\
A: Only data written into Shopify’s objects is reportable here. Ask the app to sync into Shopify or consider an integration that does.
# My Reports
This section has all the reports you've saved in Report Pundit. Find out more about it here.
My Reports Page
#### Here are the important aspects of the My Reports page:
### 1️⃣ **Search for Saved Reports**
Enter the name of a report to search and find it from your list of saved reports.
### **2️⃣** **Time Stamp of Last Sync**
It's the date and time when your app last synchronized with your Shopify store records.
### **3️⃣ Saved Reports**
This section shows all of your saved reports along with their details like:
* **Report Type**
* **Date of Creation (Created On)**
* **Date when Last Updated (Updated On)**
* **View Type (Table or List)**
* **Type of Scheduling Applied (Schedule Type)**
* **Actions (Scheduling, Editing, and Marking as Favorite)**
Here are the details of the actions you can apply to your saved reports:
* **Schedule** - schedule your reports right from here by clicking on the **Schedule button,** which'll take you through the scheduling process. To know in detail about scheduling, click [here](/getting-started/schedules).
* **Edit Report** - You can make changes to your report by clicking on the **Edit report** button.
* You can change the report's fields, date ranges, etc. However, you **can't change the** **report type**.
* **Save** the report for the changes to take effect.
* **Add to Favorites** - Click on the icon to add the report to **'My Favorite Reports**', which is displayed on the Home page.
### 4️⃣ Switching between Folder and List View
Select '**Folder**' to view reports by folder or '**List**' to view reports in ascending order of when they were saved. Click [here](https://dayspring-tech.gitbook.io/report-pundit/changelog#my-report-folder-view) to learn more about the Folder section.
### 5️⃣ Create Report
Click on '**Create Custom Report**' to view pre-created reports or to create a customized report based on your specific requirements.
# Getting Started - Schedules
All of your scheduled reports are displayed in this section, along with the history of all the scheduled reports. Read more about it below.
The dedicated Schedules section helps you manage report delivery automation in one place. It's divided into two section for convenience:
## Upcoming Schedules
Click on this tab to see upcoming scheduled reports and their respective scheduling details.

The displayed scheduling details are:
* Delivery **Frequency**
* Chosen delivery file format (**Output Type)**
* Date when the schedule task was created (**Created On)**
* When the next report delivery happens **(Next Run)**
* Actions (**Schedule Editing and Deleting**)
Details of the actions are below:
* **Edit Schedule -** You can make changes to the schedule by clicking on .
* **Delete -** You can delete the schedule by clicking on .
## Report & Schedule History
This tab displays the reports you've scheduled in the past.

The Report and Schedule History tab shows the following details:
* Delivery **Frequency**
* When the report was last delivered **(Run Date and Time)**
* When the schedule was initiated **(Start Date)**
* When the schedule process was ended **(End Date)**
* Actions (**Download and Delete)**
Here's more on the actions:
* **Download -** Besides getting your reports delivered automatically, you can download it by clicking on theicon.
* **Delete** - You can delete the report file from the server by clicking on the icon.
{% hint style="info" %}
To learn more about the scheduling process, click [here.](/knowledge-base/schedules)
{% endhint %}
# Global - Settings
Learn how you can take control of your Report Pundit account and personalize your app us in this page.
## How to Get to Settings in Report Pundit
In your Report Pundit app, click on **Settings** in the top navigation panel to open the settings page.
In the **Settings** page, you'll find this left side panel with links to the various aspects of your account you can manage.
Click on an option to learn about it in detail:
{% content-ref url="/pages/tWxaQr2qQZ8qgaE0nW8X" %}
[Account](/getting-started/settings/account)
{% endcontent-ref %}
{% content-ref url="/pages/IbS7zABE7iHf1NjO9rnG" %}
[Data Sync Options](/getting-started/settings/data-sync-options)
{% endcontent-ref %}
{% content-ref url="/pages/O9LI8x1DMHRX1slS9nbT" %}
[Global Report Formatting](/getting-started/settings/global-report-formatting)
{% endcontent-ref %}
{% content-ref url="/pages/EMOuQrkVyqruhZaJce70" %}
[FTP, Google Drive, and Google Sheets](/getting-started/settings/ftp-google-drive-and-google-sheets)
{% endcontent-ref %}
{% content-ref url="/pages/V7Udg0eCso8yW4oXhxPb" %}
[Recent Sync History](/getting-started/settings/recent-sync-history)
{% endcontent-ref %}
{% content-ref url="/pages/4S9isSmGRZfmU3tIcDHi" %}
[Custom Email](/getting-started/settings/custom-email)
{% endcontent-ref %}
{% content-ref url="/pages/LzHzJJz365hnd68lB4kE" %}
[User Management](/getting-started/settings/user-management)
{% endcontent-ref %}
{% content-ref url="/pages/24NRCqLAtqWGEoqjyyfK" %}
[Shopify staff](/getting-started/settings/shopify-staff)
{% endcontent-ref %}
# Account
Learn about the page that lets you manage your Report Pundit account.
Your **Account** control page is the default landing page for the settings link.
You get an overview of your account details like:
* **Report Pundit Plan:** Shows your current subscribed plan. (**Free Forever Plan/Essentials/Essentials Plus**)
* **Your Shopify Plan:** Shows your current subscribed Shopify plan.
{% hint style="info" %}
**Note:** Report Pundit subscription pricing is directly linked to your Shopify subscription. Click here to [know more](/faq/billing-and-sales).
{% endhint %}
* **Shop Time Zone:** Shows the **shop's time zone**. You can't edit the time zone by yourself. In case you **require** a change in time zone, kindly [**contact-us.**](https://www.reportpundit.com/contact-us)
* **Installer Email:** Shows the the Email ID used while installing the app. You can change the email address by clicking on
{% hint style="info" %}
Check the "Receive tips and best practices on reporting and data analysis" box to get email updates on the topic.
{% endhint %}
{% hint style="success" %}
You're now good on your Report Pundit account details.
{% endhint %}
# Data Sync Options
Learn about the settings available in Report Pundit to manage data synchronization with your Shopify store.
Report Pundit lets you customize how it synchronizes with your Shopify store data through multiple Data Sync options. Here is a screenshot of the settings page:
Your *Metafield, Abandoned Cart, Customer Records, Customer Journey, Incoming Inventory, and Draft Order* data are set to sync by default; *Presentment fields* and *Events* data sync is disabled by default.
To **activate/deactivate** a sync option, simply **toggle** the respective button.
# Global Report Formatting
Learn about the various formatting options available for your reports in this page.
Report Pundit has additional formatting options for deep customization of your reports under settings. These are global formatting options that apply to all reports once set.
You can enable or disable the following options by toggling the respective switches:
* **Week Start from Sunday:** Set your reports and their schedules to follow a Sunday-to-Saturday business week instead of the default Monday-to-Saturday.
* **Include Current Day:** View the current day's data in your reports with time ranges like Last 7 Days, Last 30 Days, etc.
* **Enable Currency for Reports:** Toggle the ability to choose the currency symbol shown in your reports.
* **CSV Encoding Option:** You can choose a specific encoding for your **CSV reports.**
If a currency or encoding option you need is not listed, just [**contact us**](https://www.reportpundit.com/contact-us) and we will add it for you**.**
# Week Start from Sunday
Get a detailed look into how you can match your reports with your business timeline for added customization and convenience.
If your business week starts from Sunday, you can set Report Pundit to show weekly data from then. This alters the standard business week setting in the app from a Monday-to-Saturday schedule to a Sunday-to-Saturday one.
This option offers flexibility in viewing your store data. It ensures that your reports align with your business operations and planning cycles.
## :point\_right:Steps to Change the Week Start Day
1. Go to Report Pundit’s **Settings** page by clicking on it in the top navigation bar.
2. In the left navigation panel, click on **Report Formatting**.
3. Locate the toggle switch labeled **Week Start from Sunday** to the right to enable the option. If you want to disable it, simply toggle it to the left.
Note:
* Enabling this option automatically updates the starting day of the week in both reports and schedules.
* All weekly and week-today reports are affected by changing this option.
# Include Current Day
Learn how you can add current day data to your reports for a complete view of store performance
Report Pundit gives you the ability to include current day data in certain report types. With this feature you can view the latest store data alongside data from default timelines. Now, you can get more out of your Shopify data analysis with additional insights into present day store performance too.
By default, your reports contain data until the last completed day. So, if your report has a data timeline like “Last 7 Days”, “Last 30 Days”, etc., it’ll have data between the last completed day of business and the chosen number of days in the past, without today’s data. Toggling the current day data option changes this default setting.
## :point\_right:Steps to Include Current Day Data
1. Click on **Settings** in the navigation bar.
2. Click on **Report Formatting** in the left panel in the Settings page.
3. In the **Report Formatting** page, toggle the **Include Current Day** option to the right to enable it. Or if enabled, toggle it to the left to disable the option.
{% hint style="warning" %}
This setting is only applicable to certain report types like “Last 7 Days”, “Last 30 Days”, etc. Other reports or reports with custom date ranges are not affected by this option.
{% endhint %}
# Enable Currency for Reports
Learn how you can get Report Pundit to show currency symbols in your reports
Currency symbols add perspective to Shopify financial data. Which is why Report Pundit gives you the option to add them to your reports. Enabling this option applies the symbol of your choice to relevant numerical fields, like *Total Sales, Gross Sales*, etc. in all your reports.
Example of a Sales report with US $ Currency Symbol applied
## :point\_right:Steps to Enable Currency for Reports
1. Go to Report Pundit’s **Settings** page by clicking on it in the top navigation bar.
2. In the left navigation panel, click on **Report Formatting**.
3. Locate the toggle switch labeled **Enable Currency for Reports** to the right to enable the option. If you want to disable it, simply toggle it to the left.
**Note:** You can change the symbol in individual reports by clicking on **Format** and selecting it from the **Currency** drop-down menu. If available, the local currency is shown at top of this list.
# FTP, Google Drive, and Google Sheets
Learn how to connect your Report Pundit account to various file transfer options
Configure your automated report delivery settings here by entering the required connectivity details to your FTP, Google Drive, and other destinations.
### :clipboard: Steps to Connect with FTP
To connect FTP and store reports, follow these steps:
1. Go to the '**Settings**' page and open the '**FTP & Google Drive'** section from the sidebar on the left.
2. Click on '**Connect**' to access the FTP option.
{% hint style="warning" %}
Allow the IP address shown in the notification if you're using a firewall or private network for your store database to let Report Pundit access it.
{% endhint %}
3. Enter the FTP account credentials**.** Private Key entry is optional**.**
4. Select the directory where you want to receive and store the reports, and enter the port number.
{% hint style="info" %}
**Note:** Kindly [contact us](https://www.reportpundit.com/contact-us) if you want to connect through a port other than **21** or **22.**
{% endhint %}
**Passive Mode:** It is enabled by **default** and we recommend switching to it permanently to resolve any issues. Ask your service provider to set up the FTP to accept the connection in passive mode. You can learn more about passive mode by clicking [here](https://dayspring-tech.gitbook.io/report-pundit/kb/knowledgebase-intro/schedules/output-options/ftp#steps-to-schedule-any-report-through-ftp).
5. Select a **connection mode** and click on the '**Test Connection'** button. If the result is '**Success**', click on '**Save and Update'.**
If the result is '**Failed'** or anything else**,** it could be due to many reasons:
* You might have to **whitelist** Report Pundit's IP Address
* Public IP: **54.245.198.171**
* Private IP: **172.31.10.79**
* You might have chosen the **wrong directory path.**
* You might have chosen a different **Port Number,** apart from **20** or **21.**
* You might have typed an **incorrect password.**
If you still can't connect, kindly [**contact us**,](https://www.reportpundit.com/contact-us) and we'll help you set it up.
### Passive Mode
Passive Mode is the **recommended connection** mode for FTP. In Passive Mode, the FTP client still **initiates a command** channel connection to the **server**. However, instead of **sending** the **PORT** command, it sends the **passive command**, which is a **request** to connect a server port for **data transmission**. When the FTP server replies, it indicates the **PORT number** it has opened for the data transfer. \
\
*Here's how passive mode works in a nutshell:*

1. The FTP client connects from a random port to port 21 on the server and issues the **PASV command**.
2. The server replies, indicating which (random) port it has opened for data transfer.
3. The FTP client connects from another random port to the random port specified in the server's response.
4. Once the connection is established, data transfers are made through these client and server ports.
Learn more about FTP connectivity by clicking on the tab below:
{% content-ref url="/pages/-M\_yd7837s4-vxAfkZOQ" %}
[FTP](/knowledge-base/schedules/output-options/ftp)
{% endcontent-ref %}
### Steps to Connect with Google Drive and Google Sheets:
1. Go to the **Settings** page and click the **'FTP & Google Drive'** option in the left side panel.
2. Under the Google Drive section, click on **'Connect'**.
3. Select the Google account to be integrated and grant permission to Report Pundit by clicking on '**Allow'.**

Once connected, you get the following screen:
1. **Connect Another:** Click this button to connect another Google account to your Report Pundit account.
2. The Google account currently connected to your Report Pundit account.
3. **Revoke:** Click this button to remove the currently connected Google account.
{% hint style="success" %}
That's it! You've now successfully connected your Google Drive/Sheets account.
{% endhint %}
Learn more about scheduling to Google Drive and Sheets by clicking on the respective tabs:
{% content-ref url="/pages/-M\_y91n8x8l22VVO8tLF" %}
[Google Drive](/knowledge-base/schedules/output-options/google-drive)
{% endcontent-ref %}
{% content-ref url="/pages/-M\_yM1oXyzgY0TjclgN1" %}
[Google Sheets](/knowledge-base/schedules/output-options/google-sheets)
{% endcontent-ref %}
### Big Query
You can connect with Google's Big Query service and send your Report Pundit data directly there. Find more details on how to connect in our dedicated Big Query help page by clicking on the tab below.
{% content-ref url="/pages/-MVbzhoKTO8F1NaiOFZI" %}
[BigQuery](/knowledge-base/schedules/output-options/bigquery)
{% endcontent-ref %}
### Power BI
Microsoft's Power BI is a data visualization tool that can collect your raw Shopify store data and provide business intelligence through captivating graphical representations.
You can find details on how to connect your Report Pundit to your Power BI account by clicking on the tab below.
{% content-ref url="/pages/xW7HWkl0D6eLAFnNnScj" %}
[Power BI](/knowledge-base/schedules/output-options/power-bi)
{% endcontent-ref %}
{% hint style="info" %}
[Contact our support team](https://www.reportpundit.com/contact-us) if you need any help regarding these connectivity options.
{% endhint %}
# Recent Sync History
Learn how you can check on your Report Pundit account's data sync history
Report Pundit makes it convenient to acquire your Shopify data with automated, regular data sync.
* Your data records sync every time you **access the app** or **schedule a report**.
* Sync also takes place **every 6 hours automatically,** whether you access the app or not.
Sometimes, newly [integrated application](/getting-started/settings#integrations) records or [additional sync](/getting-started/settings#data-sync-options) records may not immediately reflect in the report. In this case, you can **force sync** your records manually at any time by clicking on the button.

# Custom Email
Learn how to change your Report Pundit account's default email and schedule reports to it
You can send scheduled reports to your desired destination from a **private-domain email** address instead of **** using this feature. If you're sending your reports directly to a third-party receiver, this option helps them confirm that you're the sender.

{% hint style="info" %}
**Note:** The custom email scheduling feature does not work for **public domain** **email ids** like **gmail.com, hotmail.com, outlook.com & yahoo.com.**
{% endhint %}
#### **Steps to change your sender email ID:**
* Go to **Settings > Custom email**
* Enter the **Sender's Name** to be displayed in the receiver's inbox
* Add your **private email id**
* Optional: Include a **reply email id** If you want the recipient to reply to a different email address than the sender's.
* Once the email is added, complete the **verification** by confirming the sender's signature sent over the email.

* Once the email is **verified**, the status gets changed from **Not verified** to **Verified.**

{% hint style="success" %}
Your scheduled emails will have the custom email ID from now on.
{% endhint %}
# User Management
The user management feature enables you to create multiple admin and user accounts for better visibility and app usage control.
If you have multiple stakeholders using your Report Pundit account, you can set up and manage their access in this section.
There are two types of accounts available: **Admin** and **User.** This guide will walk you through managing user access and ensuring everyone sees the information they need.
**User seats:** Your pro plan includes up to 20 seats. Need more? Add a 10-user pack for $5/month — just contact support. The add-on is billed on top of your current plan on your approval.
## :door:Accessing User Management
To access the user management feature, click on ⚙️ **Settings** in the navigation panel and on **User Management** in the left side panel.
## :point\_right:Steps to Create an Account
1. Click the **Add Account** button in the User Management dashboard.
2. Select the type of account (Admin or User) in the drop-down menu, enter the *Username* and *Password* in the pop-up box that appears.
3. Click **Create Account** at the bottom.
That's it. The desired account will be created. Note that if you're creating a **User** account, you can click on the  icon in the *Access to* section to manage the account's access privileges.
## :point\_right:Steps to Delete an Account
1. In the **User Management** dashboard, click the **Delete** icon of your desired account.
2. A dialog box will pop-up asking you to confirm or cancel the process. Click on **Yes, Proceed** to delete the account or **Cancel** to forfeit the process.
## :passport\_control:**Admin Account**
An **Admin** account comes with **unrestricted access** to every Report Pundit features and functions. With an Admin account, you can:
* *Add and Remove Users*
* *Modify User Permissions*
* *Edit and Create Reports*
* *Change User Passwords*
{% hint style="warning" %}
Only admins can change user passwords. If a user forgets their password, they will need to contact the admin for assistance.
{% endhint %}
Here is an example of an admin account tab. It's color-coded **Orange** for easy identification.
It shows the *Username, Password (Redacted, with link to Password Edit option), Access to (All Reports),* and option to *Delete* it ().
You can add multiple admin accounts and view them in the same page.
## :closed\_lock\_with\_key:User Accounts
If you want to provide limited access to your Report Pundit data, you can set up a **User** account. This account type lets others use your Report Pundit account while protecting your sensitive data and settings.
Here is the **User** account tab as seen in the *User Management* dashboard. It's color-coded **Green** for easy identification.
It shows the *Username, Password (Redacted, with link to Password Edit option), Access to (No. of Reports),* and option to *Delete* it ().
By default, non-Admin users **cannot** access these Report Pundit functions:
* *Sidebar view*
* *Charts*
* *Field formatting*
* *Report formatting options***.**
Also, non-Admin users **cannot rename, delete, clone, or share report links**. This lets you have strong oversight and control over your account.
Screenshot of admin granted user report dashboard
{% hint style="info" %}
You can always contact us if you forget your username and password. We’ll be happy to assist you.
{% endhint %}
## :customs:User Permissions defined by Admin 👥
As an **Admin**, you have the authority to **define specific permissions** for each user and report using the following options:
1. **View Only:** Users can only view the report.
2. **Filter:** Users can apply filters to reports.
3. **Add Columns:** Users can add data columns to reports.
4. **Save:** Users can save reports.
5. **All Access:** Users can view, filter, add columns, and save reports.
## :school\_satchel:Default Options for User Reports
User reports come with handy **default options** to enhance functionality. Users can select a **date range**, **export reports**, **sort data**, and **group data** (*if a date field is selected*) for a smooth experience from the get-go.
If you have further questions or require assistance, contact our expert support team via **live chat** or at ****.
### FAQ's
**1) What’s the user limit on my plan?**\
Your base plan includes up to **20 users**.
**2) How do I add more users?**\
Add a **10-user pack for $5/month**. Just contact support to enable it.
**3) How is the add-on billed?**\
It’s **added on top of** your current plan price.
**4) Can you show me the math?**\
**Example:** $60 plan + $5 (one 10-user pack) = **$65/month**.
**5) Can I add multiple packs?**\
Yes—add as many **10-user packs** as you need. Each pack is **$5/month**.
**6) Do I need to upgrade my base plan to add users?**\
Yes. After you approve the add-on, you’ll need to upgrade to the Custom plan.
**7) How do I remove an add-on pack?**\
Contact support anytime; changes take effect on your **next billing cycle**.
**8) Is there a per-user price?**\
No. It’s a **flat $5 per 10 users** (not per individual user).
{% hint style="success" %}
You can now securely manage your Report Pundit account with multiple users.
{% endhint %}
# Shopify staff
Learn how to set up Report Pundit to acquire your store staff data
Manage your Shopify staff accounts easily with Report Pundit's automated staff details sync. With just a few clicks, you can automate staff data entry and skip manually adding those details to the app. Once synced, you can view staff details in your reports as well wherever possible.
You get the following settings options:
* View staff records with in the table with **Staff ID** and **Staff Name**.
* Search by staff name/ID in the search bar.
* **Import** Excel files with your staff data directly to Report Pundit by clicking on the dedicated button.
Check out the gif below to learn how to import your Shopify staff details to Report Pundit:
# How to Create a Custom Report and Auto-Schedule It
Learn how to create custom reports for your business with Report Pundit and have it sent automatically to your preferred destination.
## :point\_right:Steps to Create your Customized Report
1. You can find the button in two pages: '**Library'** & '**My Reports**' page. Go to either of the pages using our navigation panel on the top, and click on
2. **Name** your report. Add **Report Description** if required, and click on '**Continue**'.

3. Select your **report category** from the **13 options provided**. Once you have selected your category, you will be prompted to **confirm your selection**, and the appropriate **fields** for that category will be **displayed**. Click on "**Proceed**" to continue.
Choosing the Report Category
4. The **first report type** from the **report category** will be chosen by **default.** In case you want to see or change the report type, select the **Report Type,** and choose the Report Type, from the sidebar on the left.
Selecting the Report Type
5. Select your **desired date range** using the **Date Selector** tab. We have several **preset dates ranges** to choose from, **OR** you can select your **own start and end dates** according to your requirement.
*For example: In this case, we have chosen* *the **Last 30 days.***
Selecting the Date Range
6. To **create your repor**t, select the fields you need by using the "**Select Fields**" tab. Use the **search bar** to locate the required fields for your report, which include (in this case) *Barcode (UPC), Inventory Quantity, and Price*.
Building a custom report
7. To save the report, click on the "**Save**" button. After saving, you can access your report anytime from the "**My Reports**" page.
{% hint style="success" %}
:star2: That's it. You've successfully customized your report.
{% endhint %}
### Now, let's learn how to auto-schedule the reports.
{% content-ref url="/pages/-M\_tGj1GDwaSOjC39uTB" %}
[Email](/knowledge-base/schedules/output-options/email)
{% endcontent-ref %}
{% content-ref url="/pages/-M\_yd7837s4-vxAfkZOQ" %}
[FTP](/knowledge-base/schedules/output-options/ftp)
{% endcontent-ref %}
# Report Creation
This section contains detailed information on Reports, and it's features in the Report Pundit app.
## Table of Contents
{% content-ref url="/pages/-M\_JpsIUd0HRJxJAciDA" %}
[Customize Reports](/knowledge-base/report-creation/customized-reports)
{% endcontent-ref %}
{% content-ref url="/pages/-M\_YykivJCAqST-r2SYb" %}
[Sort](/knowledge-base/report-creation/sort)
{% endcontent-ref %}
{% content-ref url="/pages/-MVZJ9reqcq2t6aLK9Hu" %}
[Broken mention](broken://pages/-MVZJ9reqcq2t6aLK9Hu)
{% endcontent-ref %}
{% content-ref url="/pages/-M\_9yimBtxf13raI61Gj" %}
[Formatting Tools](/knowledge-base/report-creation/report-formatting-tools)
{% endcontent-ref %}
{% content-ref url="/pages/-MVZJMDvwKGnmdaZQHQO" %}
[Custom Fields](/knowledge-base/report-creation/customized-reports/custom-fields)
{% endcontent-ref %}
{% content-ref url="/pages/-MVc-Y8ttG6qBzXaJ0iB" %}
[Sharing Report Links](/knowledge-base/report-creation/sharing-links)
{% endcontent-ref %}
{% content-ref url="/pages/-MVbzMEU6pPlFhZnQT7K" %}
[Exporting the report](/knowledge-base/report-creation/export-reports-to-pdf)
{% endcontent-ref %}
# Export Reports
To immediately export reports from Report Pundit, open the report, click the export dropdown, and select the desired format such as Excel, CSV, or PDF. The report will be instantly downloaded.
XLSX - File
Report Pundit allows direct export of reports in **XLSX (Excel)** format. To do this, open the report, select the export dropdown, and choose Excel or XLSX—the file is downloaded instantly to the local device.
CSV
Report Pundit allows you to export CSV files with a custom delimiter of your choice. You can enter any delimiter (comma, semicolon, tab, space, pipe, etc.) in the CSV Delimiter box before exporting, and the export will use that character to separate values in the file
PDF
To export a report as PDF in Report Pundit:
1. Open the desired report and click the export dropdown menu.
2. Select "PDF" as the export format; you can also choose between portrait or landscape modes.
3. The PDF will be generated, often with the report name as the header, and downloaded directly to your device.
Google Sheet
Report Pundit allows **immediate export to Google Sheets** by selecting Google Sheets in the export dropdown, connecting a Google account, and specifying the destination folder and file.
Slack
Report Pundit supports exporting reports directly to **Slack channels**, allowing users to share data within team communication instantly.
1\. Connect to a Slack Workspace
* Use your existing workspace or create a new workspace.
* Ensure Report Pundit has the necessary permissions to integrate with your Slack account.
2\. Choose or Create a Slack Channel
* If you already have a channel where you want to receive the report, select that channel.
* If not, create a new channel in Slack.
3\. Add Report Pundit to the Channel
* In your chosen channel, type @Report Pundit bot and make sure it is added as a member.
* This step is required; without it, the report will not be delivered.
4\. Select File Export Type
* From Report Pundit, choose the type of file format (e.g., CSV, Excel, PDF) you want to export.
* Confirm your selection.
5\. Export the Report
* Trigger the export from Report Pundit.
* The report file will be sent immediately to the Slack channel where you added @Report Pundit.
6\. Verify Delivery
* Go to the selected Slack channel.
* You should see the report file delivered by @Report Pundit.
Big Query
{% stepper %}
{% step %}
{% endstep %}
{% endstepper %}
# Report Types
## :book: Table of Contents
{% content-ref url="/pages/-MiKK\_DgKsYFvZi\_iKBl" %}
[Sales](/knowledge-base/report-creation/report-types/sales)
{% endcontent-ref %}
{% content-ref url="/pages/-MiLG2u\_q8qkdSnQ4PoH" %}
[Orders](/knowledge-base/report-creation/report-types/orders)
{% endcontent-ref %}
{% content-ref url="/pages/-MiLNwBSsvHxL-SoIvBS" %}
[Inventory](/knowledge-base/report-creation/report-types/inventory)
{% endcontent-ref %}
{% content-ref url="/pages/-MiLL42as2tWf5xdPXHe" %}
[Fulfilment](/knowledge-base/report-creation/report-types/fulfilment)
{% endcontent-ref %}
{% content-ref url="/pages/-MiLRxCmZLV4Di2ATesa" %}
[Customer](/knowledge-base/report-creation/report-types/customer)
{% endcontent-ref %}
{% content-ref url="/pages/-MVbwfqURzSEkGJBli34" %}
[Google Analytics 4](/knowledge-base/app-integrations/google-analytics)
{% endcontent-ref %}
# Sales
Sales reports show your customer order details by criteria like sales over time, by product, by channel, and others.
Sales reports track product values as you sell them and process returns.
A **sale** is said to have occurred when a customer places an order and completes the checkout with payment. These reports include every line item and shipping charge (if applicable) in order as a separate sale item.
Sales reports include sales and returns from open, archived, canceled, pending, and converted draft orders. They do not include sales and returns from deleted or test orders.
#### Cancelled Orders
When you cancel an order, it appears as a sale for the day that it was placed and a return for the day that it was cancelled. So your sales numbers are zero for that order overall.
#### Deleted Orders and Test Orders
Only deleted and test orders placed during Shopify Payments' test mode are excluded from reports.
#### **Sales v/s Payments**
Sales reports don't track money moving between you and your customers. When a sale is made, the reports show the value of goods included in the sale, not the amount of money you've received. Depending on how you've set up your payment methods, you might not receive the actual payment until a later date.
### Common Sales Report terms
The sales reports use the following common terms:
| **Terms** | Definition |
| ------------------------- | ------------------------------------------------------------------------------------------------------------------------------------------------------------------------------------------------------------------------------------------------------------------------------------------------------------------------------------------------------------------------------------------------------------------------------------------------------------------------------------------------------------------------- |
| **Units per transaction** | Equates to **Net Quantity / Total Orders.** |
| **Average order value** | The average value of a staff's sales. |
| **Orders** | The number of orders that were placed on a given date. |
| **Gross sales** | Equates to **product price x quantity (before taxes, shipping, discounts, and returns)** for a collection of sales. Canceled, pending, and unpaid orders are included. Test and deleted orders are **not** included. |
| **Discounts** |
Equates to line-item discount + order level discount share for a collection of sales.
The total dollar value reduction applied to a sale in the form of discounts on specific products or collections, or all products.
Discounts that are applied to an all products in an order are proportionally applied to the sales for the order.
All discounts are applied before taxes.
Discounts are created using discount codes, not the compare at price.
|
| **Returns** | The value of goods returned by a customer. |
| **Net sales** | Equates to **gross sales - discounts - returns**. |
| **Shipping** | Equates to **shipping charges - shipping discounts - refunded shipping amounts**. |
| **Tax** | The total amount of taxes based on the orders. |
| **Total sales** |
Total sales will be a positive number for a sale on the date that an order was placed, and a negative number for a return on the date that an order was returned.
|
### Sales over time
It shows the number of orders and the total sales that you've made over time. You can select a unit of time in the **Group by** drop-down menu to control how the data is grouped.
### Sales by Product
The **Sales by Product** report shows the breakdown of total sales of your products, excluding shipping.
Shipping isn't included because an order can consist of several products but has a single shipping charge. For reporting purposes, the shipping charge can't be apportioned between the products in the order.
Because shipping amounts are filtered out, the tax that is shown in this report does not include taxes on shipping.
This report uses the following additional terms:
| **Term** | Definition |
| ------------------ | ------------------------------------------------------------------------- |
| **Product vendor** | The vendor of your product, if you purchase it from a third party. |
| **Product type** | The type of product you are selling. For example, hats, shirts, or shoes. |
| **Product title** | The name for your product. |
| **Net quantity** | Equates to **number of sold items - number of returned items**. |
Sometimes the data in the product fields, such as **Product type** or **Product title**, is shown as a blank space. This occurs if the data didn't exist at the time of the order.
Similarly, if any of this data is changed between orders, then the report might show multiple rows for the same product because the identifying information is not exactly the same. The reports always show the original values from the time of the order.
### Sales by product variant SKU
The **Sales by product variant SKU** report shows the breakdown of gross sales, but not the shipping cost, of your top-selling products on a more granular level than the **Sales by product** report.
Shipping isn't included because an order can consist of several products, but has a single shipping charge. For reporting purposes, the shipping charge can't be apportioned between the products in the order.
This report uses the following additional terms:
| **Term** | Definition |
| ----------------- | --------------------------------------------------------------- |
| **Product title** | The name for your product. |
| **Variant title** | The name of the product variant. |
| **Variant SKU** | The identification code of the product variant. |
| **Net quantity** | Equates to **number of sold items - number of returned items**. |
### Sales by Product Vendor
The **Sales by product vendor** report shows your vendors, and the products provided by each vendor.
### Sales by Discount
The **Sales by discount** report shows your sales grouped by the name of the discount, such as the automatic discount name or discount code. This report helps you see how often your discount codes are applied and can help you see which discounts are converting into the most sales.
The following terms are used in this report:
| **Term** | Definition |
| ----------------------------- | -------------------------------------------------------------------------------------------------------------------------------------------------------------------------------------------------------------------------------------------------------------------------------------------------------------------------------------------------------------------------------------- |
| **Name** | The name entered when the discount was created in the admin. |
| **Discount applied** | The way that the discount is applied in the checkout, either automatically or by entering a code. |
| **Discount type** | Percentage, fixed amount, free shipping, or buy X get Y. |
| **Discount code** | The code that was applied to receive the discount. |
| **Automatic discount title** | Name of the discount that was automatically applied. |
| **Orders** | The number of orders to which the discount was applied. |
| **Script discounts** |
The value of product discounts that are the result of a script that is run by the Script Editor app.
This column is shown only if you use Shopify Plus. Script discount amounts are reported for an order only if a discount code was also used on the order.
|
| **Shipping** | The shipping amount, not including shipping discounts. |
| **Shipping script discounts** |
The value of shipping discounts that are the result of a script that is run by the Script Editor app.
This column is shown only if you use Shopify Plus. Shipping script discount amounts are reported for an order only if a discount code was also used on the order.
|
| **Shipping discounts** | The value of the shipping discount. |
The discounts, not including script discounts, are based on the discount codes that you create on the [**Create discount code**](https://help.shopify.com/en/manual/discounts/create-discount-codes) page.
The sales amounts in this report include the total order values, not just the discounted items in an order.
For example, a customer purchases a T-shirt for $20 and a hat for $10 in a single order. The customer uses a discount code that takes $5 off the price of the T-shirt only. Gross sales for that order is reported as $30 and net sales is reported as $25.
### **Sales by Billing Location**
The **Sales by billing location** report shows you the country or region of the billing address for an order.
### Sales by Checkout Currency
The **Sales by checkout currency** report shows you the breakdown of your sales by customer currency used at the checkout.
The **Total sales** column reports the value of the sales in your local currency.
For example, Sarah's local currency is Canadian dollars, but she accepts payments in Australian dollars and US dollars as well. In her **Sales by checkout currency** report, Sarah sees Canadian, Australian, and US dollars listed in the **Checkout currency** column, followed by the number of orders made in those currencies, and the value of those orders in Canadian dollars.
### Sales by Channel
You can use the **Sales by channel** report to see the amount of sales for your various sales channels.
In this report, the **Sales channel name** shows the name of the channel or app that the customer used to place their order, such as **Online Store** or **Buy Button**. For sales that originated as draft orders, the report shows **Draft Orders**.
### Sales by Customer Name
The **Sales by customer name** report shows you the breakdown of orders by customer over a period of time.
####
\
# Orders
Order reports provide insight into your order volume, fulfillment, shipping, delivery, and returns.
### Product Orders and Returns
The Product orders and returns report helps you identify your top selling products, and those with high return rates. The report displays total number of products that were ordered over the selected time period and the number of them returned.
| **Term** | **Definition** |
| --------------------- | ------------------------------------------------------------------------------------------------------------------------- |
| **Product title** | The names of the products that were ordered during the selected time period. |
| **Ordered quantity** | The total number of items ordered during the selected time period. |
| **Returned quantity** | The total number of items returned during the selected time period. |
| **Return rate** | The percentage of items returned compared to the total number of items that were ordered during the selected time period. |
### Orders over time
The **Orders over time** displays total number of orders that were placed during the selected time period.
| **Term** | **Definition** |
| ------------------------- | ----------------------------------------------------------------------------------------- |
| **Orders** | Total number of orders that were placed during the selected time period. |
| **Average units ordered** | The average number of individual product units per order during the selected time period. |
| **Average order value** | The average dollar amount per order during the selected time period. |
| **Returned items** | The total number of individual product units returned during the selected time period. |
# Inventory
Inventory Reports show your current inventory information for convenient Shopify inventory management.
Inventory management is crucial to fulfill orders easily and avoid losses due to overstocking and out-of-stock scenarios. Tracking the quantity of every product down to the variant level can help you plan your restocking process, identify slow-moving stock, pinpoint location of stocks, and more.
Report Pundit has the following ready-made reports in this category:
* **Inventory on Hand** - Gives a deep look into current inventory quantity down to the variant and SKU level of each product.
* **Inventory Sale Value -** Shows the total inventory value of a product variant in your inventory. It's calculated as (Product Quantity) \* (Product Price).
* **Out of Stock Product -** Informs about the out-of-stock products in your inventory, their current stock (zero or negative for committed stocks), whether they're currently listed on the store, and when they were published.
* **Inventory Level Indicator -** Categorizes product inventory level into *High*, *Medium*, and *Low* based on their individual variant quantity, compared to a pre-defined threshold quantity.
* **Inventory by Location -** Breaks down your inventory by location.
* **Inventory by Product Type -** Breaks down your inventory by product category.
* **Inventory Cost** - Provides cost details of each product stock in your inventory, along with the total inventory value.
* **Inventory Re-order Point -** Shows you the time remaining until a particular product inventory quantity reaches a pre-set level/value required to restock it.
* **Low stock Product** - Alerts you when a particular product stock level has reached a pre-set minimum quantity by displaying the current number of stock units remaining.
* **Inventory Status -** Gives the real-time status of each inventory stock.
* **Inventory by Collections -** Displays product inventory details along with custom collections to which they belong.
* [**Snapshot**](/knowledge-base/report-creation/unique-reports#inventory-snapshot) - Captures the Inventory level at the end of each day. (This report is only displayed after the Snapshot feature is manually enabled via a request to support).
{% hint style="info" %}
More details coming soon.
{% endhint %}
# Fulfilment
Fulfillment Reports shed the spotlight on your Shopify store's fulfillment process.
### Fulfillment, Shipping, and Delivery times
The **Fulfillment, Shipping, and Delivery times** report the time taken for orders to move through the entire fulfillment process. The chart in this report plots the number of orders that completed the selected stage against each hourly or daily completion period, and shows the median (or typical) amount of time orders took to complete the selected stage.
| **Term** | **Definition** |
| ------------------- | --------------------------------------------------------------------------------------------------------------------------------------------------------------------------------------------------------------------------------------------------------------------------- |
| **Time to Fulfill** | The number of orders marked as fulfilled during the given timespan, for each hourly or daily completion period. It's calculated from when the order was received to when it was fulfilled. E.g. 20 orders took less than one hour to be fulfilled after they were received. |
| **Time to ship** | The number of orders marked as shipped during the given timespan, for each hourly or daily completion period, calculated from when the order was shipped to when it was delivered. E.g. 10 orders took between 1 and 2 hours to be delivered after they were shipped. |
| **Time to deliver** | The number of orders marked as delivered during the given timespan, for each hourly or daily completion period, calculated from when the order was received to when it was delivered. E.g. 15 orders took between 2 and 3 days to be delivered after they were received. |
### Fulfillment over time
The **Fulfillment over time** report displays the total number of orders that were either fulfilled, shipped, or delivered over the selected time period.
| Term | Definition |
| -------------------- | ------------------------------------------------------------------------- |
| **Fulfilled orders** | The number of orders fulfilled during the selected time period. |
| **Shipped orders** | The number of orders that were shipped during the selected time period. |
| **Delivered orders** | The number of orders that were delivered during the selected time period. |
# Customer
In a customer report, you can gain helpful insights about your customers, including their average order count, average order totals, and expected purchase value:
The Customers reports are limited to 250,000 customers. If you need to access customer data for more than 250,000 customers, then you can integrate Report Pundit with your Google Analytics. To learn more, go to [**Integrate with Google Analytics.** ](/knowledge-base/app-integrations/google-analytics)
The data in customer reports is based on the entire order history of the new customers in the report, not only the orders that were placed during the selected timeframe.
For example, if you view a report for November only, then a new customer from that month still shows as a repeat customer, even if they made their second purchase in December.
# Customize Reports
Customized reports bring the power of report creation to your fingertips. Take a look at how it's done so that you can make the most of your Shopify reporting with Report Pundit.
Every Shopify business is unique, with its own reporting requirements. Report Pundit recognizes this reality with Custom Report creation. Whether you want to generate a new report from scratch, or modify an existing report, the feature empowers you to gain the data you need for personalized Shopify store insights.
## :clipboard: Steps to Create your Customized Report
1. You can find thebutton in two pages: '**Library'** & '**My Reports**' page. Go to either of the pages using our navigation panel on the top, and click on
2. **Name** your report. Add a **Report Description** if required, and click on '**Continue**'.
3. Select your R**eport Category** from the **13 options** available. Once confirmed, the data fields for that category will be displayed. Click on **Proceed** to continue.
4. The first report type from the report category will be chosen by default**.** In case you want to see or change the report type, select the **Report Type,** and choose the Report Type, from the sidebar on the left.
5. Select your desired date range from the several pre-sets using the date selector tab. You can also set custom **start and end dates**.
\
For example: In this case, we have chosen the **Last 30 days** option**.**
6. To create your report, select the data fields you need via the **Select Fields** tab. You can use the **search bar** to quickly locate fields.
In this example, the fields selected are *Barcode (UPC), Inventory Quantity, and Price*.
7. To save the report, click on the "**Save**" button. You can access your report anytime in the "**My Reports**" page.
{% hint style="success" %}
:star2: That's it. You've successfully customized your report.
{% endhint %}
### **Selected Fields Panel**
You can find the data fields you've added to your report in the left side panel as shown:
The panel has a **Report Type** drop-down menu that shows what category your report falls under. You can also change the report type using this column as demonstrated above.
This drop-down menu if followed by two columns showing the data fields (columns) included in your report:
* **Numeric Columns**: displays the **numerical data fields** in your report. Ex.: Discount.
* **Text Columns**: displays the **text fields** in the report. Ex.: Product Name
The selected fields are automatically organized in the respective columns. You can manually change this order by simply **dragging and dropping** the fields***.*** Use the dotted tab to the left of each data field to move it.
### How to Edit A Data Field
Place the cursor over a data field and you'll find options to **edit** it.
{% tabs %}
{% tab title="✏️" %}
**Edit**: You can edit the field name by clicking on :pencil2:, typing in the name, and then clicking '**Okay'**.
{% endtab %}
{% tab title="👁️" %}
**Hide**: You can hide the field from the report by clicking on :eye: button. It is useful in case you don't need a calculated field to be shown. This way you do not remove the field, but only hide it.
{% endtab %}
{% tab title="🗑️" %}
**Remove:** Click on :wastebasket: to remove the selected field from the report.
{% endtab %}
{% tab title="⁝" %}
**Additional Options**: Click on the button to access other field editing options.
* **Group by:** You can group them according to Value(none), Row, and Column.
* **Aggregate type:** You can add a calculating function to the numerical field. The 'Sum' aggregate '**∑'** is set by default on all numerical fields.
* ***Sum*** - Gives you a summation of all the records in the field.
* ***Count*** - Gives you a count of all the records in the field.
* ***Count Unique*** - Gives you a count of all the unique records in the field.
* ***Min*** - Gives you the minimum value among the records in the field.
* ***Max*** - Gives you the maximum value among the records in the field.
* ***Average*** - Give you the average value among the records in the field.
* **Date Format:** You can change the date format for date fields as shown below.
{% endtab %}
{% endtabs %}
# Re-arrange columns
Report Pundit allows you to change the order of the columns in the same report at two levels: summary and detailed.
By default, both pre-made and custom reports are set to the Summary level. At this level, it's important to note that Text and Numeric columns cannot be mixed together as it may cause the report to break. However, at the detailed level, columns can be rearranged as desired.
In order to re-arrange the columns, follow the below steps: \
\
**Summary Level re-arranging columns**
Summary Level
**Detailed level re-arranging columns**
# Custom Fields
Create data fields in reports that serve your unique business needs with Custom Fields. Find the details you need to set up and operate them on this page.
Report Pundit lets you fine-tune your reports with custom fields. Expand the capabilities of your Shopify reporting by adding *Calculated* and *Static* fields alongside default ones. Add to the insights given by your reports by further drilling down on your Shopify store data.
### How to Enable This Feature
Custom Columns are disabled in Report Pundit by default for both new and existing users. It will be enabled by our technical support team from the back-end upon request. This is a one-time process. Once successfully enabled, you can create and edit custom columns as required.
## :point\_right:How to Add Custom Fields
To create a custom field, click on **Add Columns** above the first data row in a report. Then, click on **Add Custom Column** option as shown below.
In the drop-down menu displayed, choose **Calculated** or **Static** as required. Next, you'll see a pop-up box where you can give your field **a name** and:
* Add a **Static Value** if you're creating a static field
* Add **SQL code** to create a calculated field, along with one of these format options:
1. **String**: For adding **alphabets, numbers, or alphanumerical** inputs. Numbers added *won't have numerical values* and cannot be used for definite measure.
2. **Number**: For adding numerical values to the column.
3. **Boolean**: For adding **Boolean operators,** such as '1' representing 'True' and '0' representing 'False'.
4. **Date & Time**: For adding **date, day, and time** inputs to your field.
#### We have categorized Custom Fields into two types:
{% content-ref url="/pages/-MVZJc5gdBhd80U5dh4V" %}
[Calculated Columns (Fields)](/knowledge-base/report-creation/customized-reports/custom-fields/calculated-fields)
{% endcontent-ref %}
{% content-ref url="/pages/-MVZJftQfLbOWSwn-SRt" %}
[Static Field](/knowledge-base/report-creation/customized-reports/custom-fields/static-fields)
{% endcontent-ref %}
# Calculated Columns (Fields)
Learn more about Calculated Columns , an exclusive feature for Shopify merchants by Report Pundit that simplifies custom data acquisition.
Calculated columns let you add data fields to your reports tailored to your needs. You can add custom formulas using existing data during creation, and can modify it later as required.
Calculated columns deliver data that you won't find otherwise, enabling deep insights into any store metric for enhanced data-driven decisions.
## :point\_right:Steps to Create a Calculated Field
Once you've enabled the custom column feature for your Report Pundit account, follow these steps to create your desired columns:
1. Open your desired report by clicking on **Library** or **My Reports** in the navigation bar.
2. Click on the **Add Columns** button above the report's data table. You should see a pop-up menu with data columns.
3. Click on the **Add Custom Column** option at the bottom-right corner of the menu. You'll see a drop-down menu letting you choose between adding Calculated or Static field. Click on the **Calculated Field** option.
4. A new box will pop-up with sections to add column name and formula. Give the column a meaningful name and add your desired calculation.
**Defining Field Calculations**
* Use the available functions and operators to build your calculation. The function needs to be written in **PostgreSQL**.
* Only columns that already exist in the report can be used for calculation. Make sure you add all relevant columns to the report before creating a calculated field. For example, to calculate "**Sales,**" you can use the formula: \[Ordered Quantity] \* \[Product Price].
Select the desired **Output Type** (*String, Number, DateTime, or Boolean*) using the drop-down menu at the bottom.
* Format (Optional): If the **Numeric** Output type is selected, you can choose to apply formatting to the calculated column (e.g., currency, percentage).
5. Once done, click on **Save** to create the column or **Cancel** to exit without creating it.
{% hint style="info" %}
**Hint:** Type a keyword to receive suggestions to add into the editor.
{% endhint %}
{% hint style="danger" %}
**Important:** You should save the report to retain the calculated column.
{% endhint %}
{% hint style="info" %}
If you need help creating a custom column, click on **Request Custom Column** from the **Manage Column** screen or the **Need Custom Column** from the **Calculated Column** screen, describe your requirement and submit request. The Report Pundit support team will create the custom column for you.
You can also contact the support team for any custom column related issues or clarifications.
{% endhint %}
{% hint style="info" %}
**Note:** Click on **Help** **Documentation** to view various functions that you can use. It is recommended to use this feature with basic knowledge of **PostgreSQL.** To learn more about PostgresSQL syntax, please [visit this link](https://www.tutorialspoint.com/postgresql/postgresql_syntax.htm).
{% endhint %}
There are various calculations and commands which can be executed via custom fields.
{% tabs %}
{% tab title="String" %}
These are a few commands available under the **'String'** format, with syntax:
* Character Length
```
char_length([field_name])
```
* All characters in Lower Case
```
lower(string)
```
* All letters in Upper Case
```
upper(string)
```
* String Concatenation 2
```
'String: ' || integer
```
{% endtab %}
{% tab title="Numbers" %}
These are a few commands available under the **'Numbers'** format, with syntax:
* Adding two or more field values
```
[field_name1] + [field_name2]
```
* Subtracting two or more field values
```
[field_name1] - [field_name2]
```
* Multiplying two or more field values
```
[field_name1] * [field_name2]
```
* Dividing two field values
```
[field_name1] / [field_name2]
```
* **Limit** or **truncate** the decimal values to 'n' number of decimal places.
```
trunc([field_name],n)
```
{% endtab %}
{% tab title="Boolean" %}
These are a few commands available under the **'Boolean'** format, with syntax.
* Greater Than **( > ) :** Returns 'true' if first condition is greater than second condition, else return 'false'
```
[field_name1] > [field_name2]
```
* Lesser Than **( < ) :** Returns 'true' if the first condition is greater than the second condition, else return 'false'
```
[field_name1] < [field_name2]
```
* Greater than or Equal to **( >= ) :** Returns 'true' if the first condition is greater than or equal to the second condition, else return 'false'
```
[field_name1] >= [field_name2]
```
* Lesser than or Equal to **( <= ) :** Returns 'true' if the first condition is less than or equal to the second condition, else return 'false'
```
[field_name1] <= [field_name2]
```
* Equal to **( = )** : Returns 'true' if the first condition is equal to the second condition, else return 'false'
```
[field_name1] = [field_name2]
```
* Not Equal to **( != ) :** Returns 'true' if both conditions are not equal else, return 'false'
```
[field_name1] !=[field_name2]
```
{% endtab %}
{% tab title="Date & Time" %}
These are a few commands available under the **'Date & Time'** format, with syntax.
* Display Current date
```
current_date
```
* Extracts only Day from Order Date
```
extract (day from [Order Date])
```
* Extracts only Month from Order Date
```
extract (month from [Order Date])
```
* Extracts only Year from Order Date
```
extract (year from [Order Date])
```
{% endtab %}
{% tab title="Other custom fields" %}
**Trunc:** Trunc removes the fractional part of the number and rounds numbers down to the nearest integer based on the value of the fractional part of the number.
```
trunc(([fieldnme])::numeric, 2)
```
**Round:** The round() function rounds a number to a specified number of decimal places.
```
round(([fieldnme])::numeric, 2)
```
**Float:** Float is used to store approximate values, not exact values. It has a precision from 1 to 53 digits.
```
float(([fieldnme])::numeric, 2)
```
**Concat:** Concat() function adds two or more expressions together.
```
concat([field_1],' ',[field_2],' ',[field_3])
```
{% endtab %}
{% endtabs %}
## Tutorial Video: How to use Calculated Fields?
In this tutorial video, we guide you through the process of using calculated fields to generate your report.
{% embed url="" %}
# Static Field
Learn more about Report Pundit Static Fields, an exclusive feature for Shopify merchants.
Static fields are useful when you want a row to contain a **constant / repetitive** **alphabetic, numeric, or alphanumeric** input. Numbers added in a static field will **not** be considered as a numerical value and can't be used for precise measurement. You can also avoid providing an input if required.
### :point\_right:Steps to Add a **Static Field**
1. Click on **Add Columns** in any report.
2. Click on **Add Custom Column.**
3. Select **Static Column** from the drop-down menu.
4. In the pop-up box, enter your **Field Name** and **Static Value** (fixed input) in the respective sections.
5. Click on **Add** to complete the process.
{% hint style="warning" %}
Remember to **Save** the report after adding the static column to retain it.
{% endhint %}
{% hint style="success" %}
:star2:That's it! You have successfully created a **Static Field** for your report.
{% endhint %}
# Custom Properties
Use Custom Property Reports to pull rich, non-standard data from Shopify like line-item properties, metafields, note attributes, and other attributes across Orders, Products & Variants, and Customers.
### What you can report on
* Orders
* Line-item properties
* Order note attributes
* Order metafields
* Product metafields
* Variant metafields
* Customers
* Customer metafields
Tip: If a third-party app writes custom data to Shopify metafields, attributes, or line-item properties, you can include it in these reports.
***
#### Before you start
* You’ll need access to the Reports Library and permission to view the relevant Shopify objects.
* Ensure your store data is synced. If not, you’ll see a Sync now prompt when you try to add properties (see Step 5) or sync from settings > data sync options.
***
#### Create or open a Custom Property Report
1. Go to Library → Custom Property\
Open any pre-created report in the Custom Property category. We include a few related fields by default to get you started.
2. Open the Custom Property panel\
In the report header, the Custom Property button will be highlighted. Click it to add property fields.
3. Select the Property Type\
Choose where the custom data lives, e.g.:
* Order metafield
* Order note attribute
* Line-item property
* Product metafield
* Variant metafield
* Customer metafield
4. Choose the Key and Column name
* Key: the exact property/metafield key (e.g., engraving\_text, custom.gift\_message).
* Column name: how it will appear in the report.
5. Handle data sync (if prompted)
If any source isn’t synced yet, you’ll see a Sync now link. Click it to start syncing.
* Syncs typically complete in a few minutes.
* Once complete, return to the report and continue adding properties.
6. Save the configuration\
After all required sections are filled (Property Type + Key + Column name), click Save. The field is added to your report.
7. Verify the data\
Check a few rows to confirm values are populating as expected. Add, reorder, or remove fields as needed.
***
Examples
* Gift message on order line items
* Property Type: Line-item property
* Key: gift\_message
* Column name: Gift Message
* Personalization text (variant)
* Property Type: Variant metafield
* Key: custom.personalization\_text
* Column name: Personalization
***
Troubleshooting
* I don’t see values for a field.
* Confirm you selected the right Property Type (e.g., product vs. variant metafield).
* Verify the key is correct (namespace.key for metafields).
* Make sure the data exists in Shopify (check a known record in admin).
* If prompted earlier, ensure the sync finished, then refresh the report.
* “Sync now” keeps appearing.
* Start the sync from the prompt and give it a few minutes.
* If it persists, re-open the report and try again. If still stuck, contact support with the object type and key.
***
## FAQ
Can I add multiple custom properties at once?\
A: Yes. Repeat the add-field steps for each key you want in the report.
Do third-party app fields show up automatically?\
A: If the app writes to Shopify (metafields, attributes, line-item properties), they’ll appear after a successful sync.
What if my app stores data outside Shopify?\
A: Only data written into Shopify’s objects is reportable here. Ask the app to sync into Shopify or consider an integration that does.
# Filters
Report Pundit has a powerful filter feature. Filter reports based on size, color, paid, cancelled, payments pending, created date, Total spent, order count, etc.
### Where can I find these Filters?
You can find the '**Contains**' and '**Not contains**' filters in two places.
1. **Report Header**
2. **Filters Option**
## :book: Table of Contents
{% content-ref url="/pages/-M\_YzR-NzRd-KK\_hgTEi" %}
['Contains' & 'Not contains'](/knowledge-base/report-creation/filters/contains-and-not-contains)
{% endcontent-ref %}
{% content-ref url="/pages/-M\_Z-2bv32cC0CW1pzAN" %}
['Is' & 'Is not'](/knowledge-base/report-creation/filters/is-and-is-not)
{% endcontent-ref %}
{% content-ref url="/pages/-M\_Z-Jjw8GJ--DLxgEz7" %}
['Include' & 'Exclude'](/knowledge-base/report-creation/filters/include-and-exclude)
{% endcontent-ref %}
{% content-ref url="/pages/-M\_Z05QP5fBB3ybhCHKL" %}
['is Blank' & 'is not Blank'](/knowledge-base/report-creation/filters/is-null-and-is-not-null)
{% endcontent-ref %}
{% content-ref url="/pages/-M\_Z0S8s5M\_r-hjBBmKq" %}
['begins with' & 'ends with'](/knowledge-base/report-creation/filters/begins-with-and-ends-with)
{% endcontent-ref %}
{% content-ref url="/pages/-M\_Z0p9crtXwE5KonDwf" %}
['= Equals' & '!= Not Equals'](/knowledge-base/report-creation/filters/untitled)
{% endcontent-ref %}
{% content-ref url="/pages/-M\_Z41usumt10q0etnYS" %}
['> Greater than' & '< Lesser than'](/knowledge-base/report-creation/filters/greater-than-and-lesser-than)
{% endcontent-ref %}
{% content-ref url="/pages/-M\_Z4UDM3AUanxONmd7w" %}
['>= Greater than or equal' & '<= Lesser than or equal'](/knowledge-base/report-creation/filters/greater-than-or-equal-and-lesser-than-or-equal)
{% endcontent-ref %}
# 'Contains' & 'Not contains'
### How does the 'Contains' & 'Not contains' filter work?
{% tabs %}
{% tab title="Contains" %}
The **'Contains'** filter is used when you want to view specific fields with particular words.
***For example***, consider a store that has a **wide range of products**, including Sony headphones, Bose headphones, Sony TV, Apple charger, Apple iPhone 5, Apple iPhone 6, Apple iPhone 7, Apple Mac computer, Apple AirPods, Apple mouse, SanDisk music player, SanDisk Pen drive, Seagate hard disk, HP laptop, and many others.
Now, if you want to filter products that **contain** the word '**apple**', you can use the '**Contains**' **filter**.
When you apply the '**Contains**' filter for the word '**Apple**', the report will **ONLY** show **Apple products** because all the Apple products have the word '**Apple**' in their name, including Apple iPhone 5, Apple iPhone 6, Apple iPhone 7, Apple Mac computer, Apple AirPods, and Apple mouse.
{% endtab %}
{% tab title="Not contains" %}
The **'Not contains'** filter is used when you want to eliminate specific fields with a specific phrase.
***For example,*** when you **apply** the '**Not contains**' **filter** for the word '**apple**', the report will **ONLY** show **Non-Apple products**, such as Sony headphones, Bose headphones, Sony TV, SanDisk music player, SanDisk Pen drive, Seagate hard disk, and HP laptop.
{% endtab %}
{% endtabs %}
**Note:** You can add multiple filter values with the '**Contains**' and '**Not contains**' filter conditions.
*Watch this 102 seconds explanatory video to understand better:*
{% embed url="" %}
# 'Is' & 'Is not'
### How does the 'Is' and 'Is not' filter work?
{% tabs %}
{% tab title="Is" %}
The "**Is**" filter **pulls** any **given name** that **matches** the **filter** parameter.
***For example***, when the "**Is**" filter is applied to the **financial status** with the "**refunded**" parameter, the app **filters** in all the transactions with a "**refunded**" status.

{% endtab %}
{% tab title="Is not" %}
The "**Is not**" filter excludes any name that **matches** the filter parameter.
***For example***, when the "**Is not**" filter is applied to the **financial status** with the "**paid**" parameter, the app **filters out** all the **transactions with a "paid" status** and shows all **other available** statuses.

{% endtab %}
{% endtabs %}
*Watch this 85 seconds explanatory video to understand better:*
{% embed url="" %}
{% hint style="info" %}
Please note that with the "**Is**" and "**Is not**" filter condition, you can **add more than one** filter value.
{% endhint %}
# 'Include' & 'Exclude'
### How does 'Include' and 'Exclude' filters work?
{% tabs %}
{% tab title="Include" %}
The **Include** filter is used to **add more than one filter condition**.
***For example***, if you want to **filter two product titles**, "**Airbus Scale model**" and "**Airplane Painted Vintage**", among other product titles, you can apply this filter condition.
When the filter is applied, the report will **filter out** all the product titles except "Airbus Scale model" and "Airplane Painted Vintage" and **displays** them.

{% endtab %}
{% tab title="Exclude" %}
The **Exclude** filter is used to **eliminate more than one filter condition**.
***For example,*** the **Exclude** filter condition will filter out "**Airbus Scale model**" and "**Airplane Painted Vintage**" and show the **remaining product titles**.
When the filter is applied, the report will **filter out** all the product titles except "Airbus Scale model" and "Airplane Painted Vintage" and **doesn't show** them.

{% endtab %}
{% endtabs %}
# 'begins with' & 'ends with'
### How do 'begins with' & 'ends with' work?
{% tabs %}
{% tab title="begins with" %}
\
The '**begins with**' filter is used to find **all records** that **start** with a **specific prefix** and their **related** characters. \
\
For example, if we need to **filter** all **Variant SKUs** that **begin** with "**CSM**", the '**begins with**' condition will filter all **SKUs** that **start** with '**CSM**', as shown below.

{% endtab %}
{% tab title="ends with" %}
The '**ends with**' filter is used to find **all records** that **end** with a **specific suffix** and their **related** characters.
For example, if we need to filter all **Variant SKUs** that end with "**02**", the '**ends with**' condition will filter all **SKUs** that **end** with '**02**', as shown below.

{% endtab %}
{% endtabs %}
*Watch this 99 seconds explanatory video to understand better:*
{% embed url="" %}
# 'is Blank' & 'is not Blank'
### How does the 'is Blank' & 'is not Blank' filters work?
{% tabs %}
{% tab title="is Blank" %}
The '**is Blank'** filter condition is used to **filter out** records that have **NULL** values in a particular field.
***For example***, **filtering** all orders **without an email ID** using the '**is Blank'** filter condition will show **ONLY** those **orders** that **do not have an email ID** recorded in the system.

{% endtab %}
{% tab title="is not Blank" %}
The '**is not Blank'** filter condition will **show** records that **have a value** in the specified field.
***For example***, applying the 'is not **Blank'** filter condition to the **email ID** field will show **ONLY** those orders that have an **email ID** recorded in the system.

{% endtab %}
{% endtabs %}
*Watch this 69 seconds explanatory video to understand better:*
{% embed url="" %}
# '= Equals' & '!= Not Equals'
{% tabs %}
{% tab title="= Equals" %}
**Equals** filter is used to find records that are equal to a specific value.
***For Example*****,** we need to find records of Ordered Quantity that are equal to 2. Here the '**equals'** condition filters out other values and displays 2 as shown below

{% endtab %}
{% tab title="!= Not Equals" %}
**= Not equals** filter is used to find records that are not equal to a specific value.
\
***For Example*****,** we need to find records of **Tax** that are not equal to 0. Hence, the '**not equals'** condition filters out the values that are 0, as shown below.

{% endtab %}
{% endtabs %}
*Watch this 80 seconds explanatory video to understand better:*
{% embed url="" %}
# '> Greater than' & '< Lesser than'
{% tabs %}
{% tab title="Greater than " %}
We can use **greater than** filter to show values that is greater than the given condition.
***Example:*** Filter '**Tax Amount'** values that are **greater than** 100.

{% endtab %}
{% tab title="Lesser than" %}
We can use **lesser than** to show values that are lesser than the given condition.
***Example***: Filter Tax Amount values that are **lesser than** 10.

{% endtab %}
{% endtabs %}
{% embed url="" %}
# '>= Greater than or equal' & '<= Lesser than or equal'
{% tabs %}
{% tab title=">= Greater than or equal " %}
We can use the **(>=)** *greater than or equal to* filter to receive values equal to or greater than the given condition.
**Example**: Filter Total sales values that are **equal to or greater than** 200.

{% endtab %}
{% tab title="<= Lesser than or equal" %}
We can use the **(<=)** *lesser than or equal to* filter to receive values equal to or lesser than the given condition.
**Example**: Filter Total values that are **equal to or lesser than 2**00.

{% endtab %}
{% endtabs %}
{% embed url="" %}
# Sort
Sort feature helps arrange a report's data values in your preferred order. It's a handy function to drill down your Shopify store data for easier data analysis and finer insights.
{% tabs %}
{% tab title="Sort by Ascending" %}
Sort any field in reports by ascending order to show values from smallest to the largest, or alphabetically from A to Z.\
\
**For Example**: Sorting the report by Product Title arranges field values to start from 'A'.
You also have an option to limit the number of rows shown per page to the Top 10, 25, 50 or 100.
{% endtab %}
{% tab title="Sort by Descending" %}
The Descending Sort feature lets you arrange data to show the highest value first and lowest value last. For text, reverse alphabetical order is applied (from Z to A).
**For Example**: Applying the descending sort to a report's Product Title column places products with names starting from Z first, then those with Y, and so on.
You can also limit the number of rows shown per page to the Top 10, 25, 50, 100, or see all rows on the same page.
{% endtab %}
{% tab title="Multi-Sort" %}
Sort multiple fields in ascending or descending order as required. This sorting allows for flexibility in applying the sort function for enhanced data analysis. \
\
**Ex:** Sorting **Product Title** in ascending order and **Net Quantity** in descending order.
You can limit the number of rows shown per page to the Top 10, 25, 50, 100, or see all of them.
{% endtab %}
{% endtabs %}
# Data Comparison
The Report Pundit Data Comparison feature empowers you to set your Shopify business on route to success by revealing how effectively you’ve run it . Find all details about it here.
Comparing present and past sales performance tells you if your Shopify store is on track to meet its goals. We’ve made it convenient for you to do that with the newly built-in Compare feature. By enabling it, you can view your store’s past and present data on sales, order numbers, discounts, etc., in one place.
**How to enable Data Comparison in your reports:**
1\. Navigate to the report of your choice, or create a new report, containing the **Date** data column. You can add the **Date** column if it’s missing in the report by default.
*Note: The Date data field is only available in a limited number of report types.*
2\. Click on the date range selection tab in the report to reveal selection options.
3\. Click on the **Show Comparison** slider button. The slider background should turn blue, indicating that comparison is now enabled.
4\. Select your desired date range. To compare data, choose **Previous Period** or **Previous Year** from the drop down menu, and pick the relevant duration. Once done, click on **Save.**
The app presents a table showing rows of start and end dates for your chosen period, alongside data columns with corresponding data values. The specific data columns vary based on the report type.
### ***Important: The following conditions apply to the compare feature***
* It’s restricted to the Sales, Edited Sales and Order report types
* It’s only available for single shop summary reports
* The report must have the Date column
* You can’t use report formatting (subtotal, grand total on top, group by etc.) when comparing is enabled
* Real-time and scheduled exporting only provide the current date row
* Past Grand Total values are unavailable
* It gets automatically disabled if any Filter is applied to a numeric data column
* Only shows data if it’s available for the current period, displaying ‘0’ otherwise
{% hint style="success" %}
That's it! Understanding your Shopify store performance clearly just got easier.
{% endhint %}
# Formatting Tools
The reports can be altered based on your requirements using our formatting tools.
Click on the '**Formatting**' button to access the formatting tools.


Click on the respective buttons to **enable** the settings. You can enable multiple settings at a time. These are the formatting tools and their functions:
## **Show Grand Total**
Enabling this option will give you the total of each numerical fields in the last row of the report. This setting is usually enabled by default.

## **Show Sub-total**
When the subtotal is enabled, the report will give the total of a group of values. The grouping is based on the first column from the left and its common inputs.
{% hint style="info" %}
**Note:** It only gives you the **sub-total of numerical fields.**
{% endhint %}
Here are a few examples.
:heavy\_check\_mark: Sub-total by **Order Date** :calendar:

Here, the **order date** is in the **first column,** which is a **necessary requirement** for the Sub-total feature to work. Learn how to re-arrange fields by clicking [here.](/knowledge-base/report-creation/customized-reports#re-arrange-fields)
:heavy\_check\_mark: Sub-total by **Product Name**

Again, having the **'Product Name'** in the **first column** is **essential** for Sub-total to work.
## **Show Grand total on top**
Enabling this option shows the 'Grand Total' on the first row below the fields.

{% hint style="info" %}
**Note:** For this option to work, you must enable **"Show Grand Total".**
{% endhint %}
## **Wrap Primary Records**
When Wrap Primary Record is enabled, all data contained in the first column from the left will be grouped into its common inputs.
Here are a few examples,
:heavy\_check\_mark: Wrap Primary Records by **Order Date**

Here, the **order date** is in the **first column,** which is a **necessary requirement** for the 'Wrap Primary Records' feature to work. Learn **how to re-arrange fields** by clicking [**here**.](/knowledge-base/report-creation/customized-reports#re-arrange-fields)
:heavy\_check\_mark: Wrap Primary Records by **Product Title**

Again, having the **'Product Name'** in the **first column** is **essential** for 'Wrap Primary Records' to work.
## Show Detailed Report
When this is enabled, the report will display detailed records by individual transaction.
**For Example:** In a normal report, the transactions are summarized under the respective order dates. But in a detailed report, each transaction is shown in a distinct row along with the exact time of the order.

## **Report Name for PDF Header**
When you export the report as PDF, the report name appears on the top as the Header as shown below. This option is enabled by default.

## Insert Currency Format
Select the currency format to add symbols to currency-related number columns.

{% hint style="info" %}
**Note:** This is not a currency conversion tool. It is to be used only to add currency symbols to the reports.
{% endhint %}
## Select CSV Format
We can enter any delimiter into the CSV Delimiter box, which acts as the separator when we export the file.

The most common delimiters are
* Comma ( , )
* Semi-Colon ( ; )
* Tab ( \t )
* Space ( )
* Pipe ( | )
# Sharing Report Links
Learn more about how to create shareable links to your created Report Pundit reports.
Report Pundit allows you to generate secure shareable links for any report. This enables you to provide access to staff members, accountants, vendors, or other stakeholders without sharing your Shopify login credentials.
For additional protection, shared reports can be secured with a password.
**Important Notes**
* The fields and structure of the shared report cannot be modified by recipients.
* Any changes made to date range, sorting, or filters in the shared view will not affect the original (master) report.
* Recipients cannot save changes to the report configuration.
### **How to Enable the Share Link**
Follow these steps to share a report:
**Step 1:** Open the Report
Navigate to the report you want to share.
**Step 2:** Access the Share Option
Click the three-dot (ellipsis) menu located in the top-right corner of the report.
**Step 3:** Select “Share Link”
Click on “Share Link” from the dropdown menu.
**Step 4:** Add Recipient Details
**Enter:**
* Recipient’s Name
* Recipient’s Email address
**Step 5**: Choose Access Level
### **Select the level of access you want to provide:**
1. **All Access** – Full interaction (view, filter, sort, export)
2. **Sort Only** – Can only sort report data
3. **Filter Only** – Can only apply filters
4. **Filter & Sort** – Can apply both filters and sorting
5. **View Only** – Can only view the report
**Step 6:** Set a Password
Add a secure password to protect the shared report.
**Step 7:** Send the Invitation
**Click Send.**
An email invitation will be sent to the recipient. The email will include:
* The report link
* The password required to access the report
Recipients can access the report using the link and password provided.
***
### **What Recipients Can Do**
By default, recipients are able to:
* Change the date range
* Apply filters (if permitted by access level)
* Sort data (if permitted by access level)
* Export the report in:
* XLSX
* CSV
* PDF
***
#### **Restrictions**
Recipients:
* Cannot edit report fields
* Cannot modify the report structure
* Cannot save changes to the original report
* Any filters or sorting applied in the shared view will not impact the master report
***
This feature ensures secure sharing while maintaining full control over your original report configuration.
# Exporting the report
Learn about how to export reports to Excel, CSV, PDF & Google Drive
{% hint style="info" %}
**Note:** The number of fields that will appear in the PDF file depends on the type of fields selected. If the field contains lengthy data, such as URL links & descriptions, the PDF may limit the number of fields displayed. It is recommended to select only the most necessary fields for the PDF. Additionally, the PDF format can be exported in portrait & landscape modes.
{% endhint %}
### :clipboard: **Steps to Export Reports without scheduling.**
**1)** **Open** the report that you want to export
**2)** **Click** the **dropdown** menu on the export widget and **select** the desired **format** (**Excel**, **CSV**, **PDF**, or **Google Drive**).

**3) If** you select **Excel** or **CSV**, the report will be **automatically** downloaded to your **default download folder**. **If** you select **PDF**, the report will open in a new tab, which you can **manually 💾save** or **🖨️print**.

#### Export reports to Google Drive
1\) **Click** the arrow in the **Export** Button

2\) Select **Export to Google Drive**

3\) Select the **Google Drive** account or **connect** to a new account if you need.

4\) Select a folder and click the **Export** button to export the report to Google Drive
{% hint style="success" %}
:star2:Great job! You have successfully exported your reports.
{% endhint %}
# Unique Reports
This page holds information regarding report types which possess fields which are unique to that particular type of report.
## Edited Sales
Shopify recently introduced **Order Editing**, which allows merchants to **add** products/quantities and **remove** products/quantities.
The **Edited Sales** Report reflects all the changes/edits made to the records of your Shopify store.
**For example,**
**If** you generate a report, opting for the **'Sales'** or **'Order'** type, any changes made to the orders will not be reflected in the report
However, **if** you choose '**Edited Sales**' as the report type, the report will reflect all the edits made to the orders.
## Abandoned Checkout
An **Abandoned Checkout** occurs when a customer **adds items** to their cart but **fails** to complete the **payment** process. This is a common practice in eCommerce, and abandoned checkout emails ((available through Shopify or apps) are an effective way to encourage customers to complete their transactions.
Customers fail to complete transactions for several reasons.
* They find **shipping fees to be high**
* They decide on looking for a **similar product elsewhere for comparison**
* They just **change their minds** about purchasing the product.
Engaging with customers is the only way to understand why they did not complete their orders.

To learn **how to create a customized report**, [**click here.**](/knowledge-base/report-creation/customized-reports)
{% hint style="info" %}
:woman\_raising\_hand:If you've got a question that we haven't answered, feel free to [**contact us.**](https://www.reportpundit.com/contact-us)
{% endhint %}
# Other Options
These options can only be performed on saved reports which you can find under 'My Reports' section under 'Reports Dashboard'.
## *Clone/Duplicate a Report*
1. Select the report which you want to duplicate from '**My Reports**' tab.
2. Click on button (next to the 'Save' button).
3. Select the **'Clone'** option.
You'll be able to see the cloned report under **'My Reports'** tab.
## *Delete a Report*
1. Select the report which you want to delete from '**My Reports**' tab.
2. Click on button (next to the 'Save' button).
3. Select the '**Delete'** option.
## *Share Report Link*
Share Report Pundit's report link to your staff members, accountants, vendors etc, without sharing the Shopify login credentials.
The report link can be password protected. The fields & data in the share link cannot be modified. Also the date range changes, sort & filter changes made in the “shared link report" will not have any effect on the master report.
Regenerating the link will revoke access to the existing link shared. The share link option will be generated only when the report is saved & the report page is reloaded.
### :clipboard: **Steps to enable the Share link option:**
1. Open the report you want to share
2. On the top right-hand corner, click the menu.
3. Select *'*share link' option
4. Enable the share URL
5. Enter the password
6. Copy the link & share it along with the password
{% hint style="success" %}
:star2: Great job! You're all done.
{% endhint %}
# Staff Details
Report Pundit can automatically add your staff information to your reports. Learn how to set it up for hassle-free staff management.
Report Pundit lets you import staff details directly into the app without having to go through Shopify admin.
Here’s the correct steps to import staff details:
1. **Access Settings:** Open Report Pundit and navigate to Settings.
2. **Locate “Shopify Staff”:** In the Settings menu, find Shopify Staff in the left navigation panel and click on it.
3. **Click on “Import”:** Click on the Import button on the page. You may click on an alternate link as well if provided.
4. **Click on “Open this page”:** In the pop-up message box, click on the Open this page link.
5. **Paste the data:** A new page will open with staff data in the form of code. Simply copy that code and paste it in the space provided in the message box.
6. **Confirm Import:** Once pasted, click on the Import button at the bottom of the pop-up.
That’s it! Your reports will automatically contain staff details wherever applicable.
**Important:**
* You may see a different interface for Report pundit than the one mentioned above, but don’t worry. The general steps will be the same.
* If you want more information about staff data importing, go to Report Pundit Help documentation.
* You’ll need to repeat the staff data importing process above every time you add or remove a staff member. This ensures that your reports have the latest information.
# App Integrations
These are the Integration options provided by Report Pundit. Once Integrated, you can create report with unique fields specific to your Integrated account and its data.
## Table of Contents
{% content-ref url="/pages/-MVbwfqURzSEkGJBli34" %}
[Google Analytics 4](/knowledge-base/app-integrations/google-analytics)
{% endcontent-ref %}
{% content-ref url="/pages/-MVbxINahfQ99IlQuqN7" %}
[Facebook](/knowledge-base/app-integrations/facebook)
{% endcontent-ref %}
{% content-ref url="/pages/-MdQXMxMpRUhc6V\_eViB" %}
[Stripe](/knowledge-base/app-integrations/stripe)
{% endcontent-ref %}
{% content-ref url="/pages/yAr05zDzIeWktuivRodO" %}
[Klarna](/knowledge-base/app-integrations/klarna)
{% endcontent-ref %}
{% content-ref url="/pages/jqdSfIg3yzYF6JzOOUdl" %}
[Amazon Ads](/knowledge-base/app-integrations/amazon-ads)
{% endcontent-ref %}
{% content-ref url="/pages/Z13SQukfVnnvxPB2r9Gm" %}
[Bing Ads (Microsoft Ads)](/knowledge-base/app-integrations/bing-ads-microsoft-ads)
{% endcontent-ref %}
{% content-ref url="/pages/1x8gGIcxt0VYbcjvP0qP" %}
[TikTok](/knowledge-base/app-integrations/tiktok)
{% endcontent-ref %}
{% content-ref url="/pages/enRhYoaqKFdUryOtLYNV" %}
[Snapchat](/knowledge-base/app-integrations/snapchat)
{% endcontent-ref %}
{% content-ref url="/pages/PNvxh7k3zqdFxf9icJW9" %}
[Easy ship](/knowledge-base/app-integrations/easy-ship)
{% endcontent-ref %}
{% content-ref url="/pages/RHEhdyf9PzJNwWd87wY3" %}
[Ship Station](/knowledge-base/app-integrations/ship-station)
{% endcontent-ref %}
{% content-ref url="/pages/PNvxh7k3zqdFxf9icJW9" %}
[Easy ship](/knowledge-base/app-integrations/easy-ship)
{% endcontent-ref %}
{% content-ref url="/pages/CYW3nQxRtWKm23jwHpJj" %}
[Shippo](/knowledge-base/app-integrations/shippo)
{% endcontent-ref %}
{% content-ref url="/pages/FDm3qD72hjMXv3BnFoYl" %}
[Ship Hero](/knowledge-base/app-integrations/ship-hero)
{% endcontent-ref %}
{% content-ref url="/pages/aB8Q4GfNepPnLqE1rDiu" %}
[Recharge Payments](/knowledge-base/app-integrations/recharge-payments)
{% endcontent-ref %}
{% content-ref url="/pages/yMfcqJJFpZg2bkvZvq2v" %}
[Authorize.net](/knowledge-base/app-integrations/authorize.net)
{% endcontent-ref %}
{% content-ref url="/pages/0WLHARckHm4nsLvPEhje" %}
[Bold](/knowledge-base/app-integrations/bold)
{% endcontent-ref %}
{% content-ref url="/pages/xGKrfcQoEXGwyen8sXfn" %}
[Printful](/knowledge-base/app-integrations/printful)
{% endcontent-ref %}
{% content-ref url="/pages/4G6EUG48BXVEYfamI6iH" %}
[Pinterest Ads](/knowledge-base/app-integrations/pinterest-ads)
{% endcontent-ref %}
{% content-ref url="/pages/4G6EUG48BXVEYfamI6iH" %}
[Pinterest Ads](/knowledge-base/app-integrations/pinterest-ads)
{% endcontent-ref %}
# Stocky
Stocky by Shopify is an inventory management app included with Shopify POS Pro subscriptions. It helps track your inventory levels, forecast inventory needs, receive product recommendations, and more.
Stocky is Shopify's way of helping its POS Pro plan subscribers optimize their inventory. It has many inventory management features like:
* Purchase order creation and management
* Supplier communication channel
* Product recommendations based on profitability
* Product location transfer and tracking
* Stock reporting and analytics
* Vendor management based on stock levels, etc.
A lot of data is generated when using these features. Stocky integration for Report Pundit compiles that data for your convenience in your custom reports. Gain full awareness of your order flow and stocking process for smooth selling with this powerful combination.
## :point\_right:How **to Integrate Stocky with Report Pundit**
1. Navigate to the **'Integrations'** page using the navigation bar at the top.

2. Select **Stocky** from the list of integrations.
3. Enter API token and click connect.

Fetch the API key by contacting Shopify. Once they've enabled the option in Stocky preferences, the key will be visible in **Stocky preferences> API access.** \
\
**Note:** There is no proper documentation from Shopify to fetch the API token. We suggest you to contact Shopify.
{% hint style="success" %}
Once confirmed, you’re ready to get reports containing Stocky data.
{% endhint %}
# UpPromote
UpPromote revolutionizes affiliate marketing for Shopify merchants. This dynamic platform can boost online business growth and sales through effective affiliate partnerships for Shopify merchants.
Affiliate marketing brings the wide reach and brand value of social media influencers to your brand. UpPromote helps you manage functions related to affiliate marketing like:
* Building custom affiliate programs
* Recruiting and communicating with affiliate partners
* Boosting partner performance with incentives and other motivators
* Auto-generation and distribution of discount codes/coupons to customers and affiliates
* Tracking and managing all affiliate personnel, including activities
By integrating your UpPromote account with Report Pundit, you get easy access to all affiliate data right in your custom reports. Make rewarding data-driven decisions regarding your affiliate marketing campaigns to build better partner and customer relationships.
## :point\_right:How **to Integrate UpPromote with Report Pundit**
1. Click on **Integrations** in the Navigation bar.

2. Select **UpPromote** from the list of integrations.
3. Enter the API Key and click **Connect.**

You can create an API key by going to **Settings** > **Integration** > **API** > **Create API Key** in your UpPromote account.
4. Contact our support team through [live chat](https://www.reportpundit.com/contact-us) or [by email](mailto:support@reportpundit.com) for creating custom reports with UpPromote data.
{% hint style="success" %}
You're now ready to use UpPromote with Report Pundit to monitor your affiliate marketing campaign.
{% endhint %}
# Yotpo
Yotpo is a commerce marketing cloud with the most advanced solutions for customer reviews, user-generated content marketing, visual marketing, loyalty, and referrals.
## :clipboard:**Steps to Integrate Yotpo**
1. Navigate to the **Integrations** page using the navigation bar at the top.

2. Select **Yotpo** from the list of integrations.
3. Enter the **Client Id, Client Secret and click connect**

## How to retrieve the App key and Secret key
Your app key is sometimes referred to as your Store ID.\
\
*To retrieve* ***App Key***
1. Log into your Yotpo admin.
2. At the top right corner of the screen, click the Profile Icon.
3. Select **Store Settings.** You’ll find your app key at the bottom of the General Settings section.

***Retrieving Secret Key***\
*Your* secret key is sometimes referred to as your API secret.
1. Follow the steps above to get to your Store Settings.
2. From your General Settings, click **Get secret key**. We’ll send an email with a verification code to the email address associated with your account.

3. Paste the code from the email and click **Submit**. Your secret key will be revealed on the next screen. Remember, only share your secret key with parties that should have access to your data!\
\
You can also follow the [steps here ](https://support.yotpo.com/en/article/finding-your-yotpo-app-key-and-secret-key)to find the credentials.
{% hint style="info" %}
Your secret key is only visible to the Yotpo account administrator. Teammates with Staff permissions cannot view the secret key. [Learn more](https://support.yotpo.com/en/article/user-management-1053748)
{% endhint %}
4. **Contact support**
Contact our support team through [live chat](https://www.reportpundit.com/contact-us) or [by email](mailto:support@reportpundit.com) for help in creating reports
{% hint style="info" %}
That's it! Your Yotpo data will be available in your reports.
{% endhint %}
# Sezzle
Sezzle is an alternative payment platform that lets your customers 'buy now and pay later' with interest-free instalment plans on select online stores.
Sezzle's instalment-based payment plans can help break high price barriers for your customers, driving up your sales figures and cart sizes.
With many buyers paying different amounts over varied time periods, tracking your customers' Sezzle payments is crucial. Integrating Sezzle with your Report Pundit account makes gathering, arranging, and viewing that data a breeze. You even get custom report generation to boot.
This integration lets you track key Sezzle metrics like:
* Percentage of customers using Sezzle
* Average order value of a Sezzle purchase
* Conversion rate of your Sezzle-using customers
* Overall increase in your transaction value, etc.
## :point\_right:How to Integrate Sezzle with Report Pundit
1. Navigate to **Integrations** using the navigation bar at the top.

2. Click on **Sezzle**. Enter the Public & Private keys. Follow the instructions on [this page](https://docs.sezzle.com/docs/plugins/shopify-payments) to get your Public & Private keys.
3. Connect Sezzle and contact our support team to create reports.
{% hint style="success" %}
That's it! You're all done.
{% endhint %}
# Square
SquareUp allows the admin to accept payments in their Shopify store using the Square payment method.
:clipboard: ***Steps to Integrate your Square account to Report Pundit***
:heavy\_check\_mark: Navigate to the **'Integrations'** page using the navigation bar at the top.

:heavy\_check\_mark:Select **Square** from the list of integrations
:heavy\_check\_mark: Enter the **User name** and **Password.**

:heavy\_check\_mark: Sign in and contact our support team through [live chat](https://www.reportpundit.com/contact-us) or [by email](mailto:support@reportpundit.com) for help in report creation
# PayPal
Learn more about how to connect your PayPal account to Report Pundit (beta mode).
{% hint style="info" %}
PayPal integration will be done backend. Please get in touch with us via LiveChat or email us at with your Client ID and Secret Key we will integrate PayPal into your Report Pundit app. Read below to acquire your Client ID and Secret Key.
{% endhint %}
## **How to acquire PayPal login details (Client ID and Secret Key)**
:ballot\_box\_with\_check: Login to your PayPal developer account
:ballot\_box\_with\_check: On the left-hand side, click “My apps and credentials”
:ballot\_box\_with\_check: Under "My apps & credentials", enable the “Live” option
:ballot\_box\_with\_check: Click the "Create App" button
:ballot\_box\_with\_check: Enter the app name as “Report Pundit” and click the “Create App” button.
:ballot\_box\_with\_check: Once the create app button is clicked, it will generate a Client ID and Secret Key.
:ballot\_box\_with\_check: You can find the Client ID and Secret Key under the Report Pundit.
:ballot\_box\_with\_check: Also, please checkmark App feature options like **Accept payments, Invoicing, Payouts, Customer Disputes, Transaction Search, and save the settings.**
:ballot\_box\_with\_check:There you go. Now you have your *Client ID* and *Secret Key***. Contact us** at ** or via *Live Chat* and help us with your Client ID and Secret Key. That's all! Now, sit back and relax! We will get the job done for you.
{% hint style="info" %}
Pre-created Payout reports like PayPal Payouts & Payouts (order details) exist. Additionally, you can also create a customized PayPal transaction report. [Click here](https://docs.reportpundit.com/kb/knowledgebase-intro/reports/customized-reports) to learn how to create a customized report.
{% endhint %}
# Google Analytics 4
Learn more about how to connect your Google Analytics account to Report Pundit.
**Note:** To gather GA4 data, your Google Analytics account should be integrated with your Shopify store.
### Why You Should Use the Google Analytics Report
Google Analytics reports let you track your marketing funnel's performance over time. You can examine each stage of your customer's journey, from visitor arrival to order completion. Analyzing this data with Shopify's revenue figures gives a comprehensive view of your store's health.
* Analyze top marketing channels, compare them to your leading sales channels for effective budget allocation.
* Track metrics for both new and returning shop visitors, noting checkout process drop-offs at billing, payment, or confirmation stages.
* Review Google Analytics for your daily ad spend, cost per click, sessions, bounces, hits, user types, and accurate order count. Also, learn about cart and checkout abandonments.
So, the Google Analytics report is your key to unlocking your marketing and overall business potential.
### :clipboard: **Steps to Integrate Google Analytics**
1\. Navigate to the **Integrations** page using the navigation bar at the top.
2\. Select **Google Analytics** and click on **Sign in with Google.**
3\. Select the Google account to be integrated. If it isn't on the list, click on **Use another account** and enter the account details.
4\. You'll see a message asking for permission to grant access to Report Pundit. Simply click the **Continue** button to proceed.
5\. Your Google account has been successfully integrated. Finally, select the appropriate Account & Property option and click **Save.**
Report Pundit has pre-created visitor metrics reports such as *Google User type*, *Google Source*, *Google Medium*, and *Google Campaign*. Additionally, you can create a custom report from the Reports Dashboard.
{% hint style="success" %}
:star2: Great job! You're all done.
{% endhint %}
# Amazon Ads
Amazon Ads aims to provide registered sellers everything they need to achieve their advertising goals. The app has a wide range of products for the purpose that's usable on Amazon and other channels.
Report Pundit's integration with Amazon Ads brings crucial ads performance data directly to your Shopify reports. Get to know how your ad campaigns are performing across a range of ad channels, including Amazon.
Dive deep into your individual campaign data, such as special sale periods, to gain practical insights into your strategy, target audience, ad spend, and brand value.
### :point\_right:How to Integrate Amazon Ads with Report Pundit
Here are the steps to integrate:
1. Click on **Integrations** in Report Pundit’s navigation bar.
2. The **Amazon Ads** integration option should be visible. If not, scroll until you find it. It can also be found in **Recently Added** and **Marketing** on the left.
3. Click on it and then on the **Connect** button.
4. Follow the on-screen instructions to Log in to your Amazon seller account and integrate the two apps.
{% hint style="success" %}
Once confirmed, you’re ready to get reports containing Amazon Ads data.
{% endhint %}
# Bing Ads (Microsoft Ads)
Bing Ads (Microsoft Ads) is the company's digital Ad platform for brands to increase visibility and reach. Report Pundit now integrates with Bing ads for data-driven ad campaign management.
Microsoft Ads (aka Bing Ads) lets you control your campaigns across Microsoft's Search Network. This includes Bing, Yahoo, and MSN search engines, along with Microsoft's partner sites.
Unlock deep insights into your Microsoft Ads campaigns by integrating it with Report Pundit. You get data on your PPC campaigns to use for fine-tuning ad campaigns. Know your target audience better and adjust your budget, messaging accordingly for better RoAS.
### :point\_right:How to Integrate Bing Ads with Report Pundit
Here are the steps to integrate:
1. Click on **Integrations** in Report Pundit’s navigation bar.
2. The **Bing Ads** integration option should be visible. If not, scroll until you find it. It can also be found in **Recently Added** and **Marketing** on the left.
3. Click on it and then on the **Connect** button.
4. Follow the on-screen instructions to Log in to your Microsoft account and integrate the two apps.
{% hint style="success" %}
Once confirmed, you’re ready to get reports containing Bing Ads data.
{% endhint %}
# Facebook
Learn more about how to connect your Facebook account to Report Pundit (beta mode).
Know the performance of each ad on Facebook –clicks, reach, impressions, conversion value, watch time of video ads spend for each Facebook campaign. Connect your Facebook account to integrate your Facebook marketing cost and know the CPM, CPC, CPP, CTR, Impressions, reach, social spend, spend, etc.
Integrate Facebook to know the Insights.
### :clipboard: Steps to Connect Your Facebook Account
:heavy\_check\_mark: Navigate to the **'Integrations**' page using the navigation bar at the top. Select option.

:heavy\_check\_mark: Click on '**Connect'.**
:heavy\_check\_mark: A screen will appear asking "**What is Report Pundit allowed to do**?". Select the settings and click "**Done**".

:heavy\_check\_mark: In the final step, click "**OK**" for the message "**You've now linked Report Pundit to Facebook**" to complete the integration.
{% hint style="info" %}
**Note:** After the Integration, [**force sync**](/getting-started/settings#force-sync) the data. It will take few minutes to sync the Facebook data.
{% endhint %}
{% hint style="success" %}
:star2: Great job! You're all done.
{% endhint %}
# Snapchat
### :clipboard: Steps to Integrate Snapchat
:heavy\_check\_mark: Navigate to the "**Integrations**" page using the navigation bar at the top.

:heavy\_check\_mark: Select **Snapchat** from the list of integrations
:heavy\_check\_mark:Enter the **User name** and **Password**

:heavy\_check\_mark:Contact our support team through live chat or by email.
Let us know which fields you require, and we shall set it up for you.
{% hint style="success" %}
You have successfully Integrated Snapchat with Report Pundit.
{% endhint %}
# TikTok
TikTok Business leverages the popularity of the short video format platform to help eCommerce merchants run ad campaigns. Make your brand and products go viral to quickly grow your Shopify business.
A relatively new entrant, TikTok has made waves in the social media sphere rapidly. The platform's short video format helps influencers deliver content quickly while maintaining their audience's attention. The format also helps them pump out multiple videos daily, ensuring relevance, consistency and high engagement.
The above-mentioned characteristics makes the platform a great channel for eCommerce marketing. Deliver ads quickly without shooting over your budget. Go viral and boost your brand visibility in a snap. Report Pundit now integrates with TikTok Business to bring your TikTok ad campaign data.
Stay in step with your marketing on the platform with accurate data that's packaged and delivered the way you want. Track user data, ad clicks, conversion rates and more with this simple and effective integration.
### :point\_right:How to Integrate TikTok Business with Report Pundit
Here are the steps to integrate:
1. Click on **Integrations** in Report Pundit’s navigation bar.
2. The **TikTok** integration option should be visible. If not, scroll until you find it. It is also likely to be found under **Recently Added** in the left column.
3. Click on the panel to reveal the **Connect** button.
4. Click on the **Connect** button and follow the on-screen instructions to integrate the two apps.
{% hint style="success" %}
Your TikTok account is now integrated with Report Pundit.
{% endhint %}
# Easy ship
Connect your Easyship account to Report Pundit and get complete visibility into your shipping operations — all alongside your Shopify store data.
Report Pundit's Easy ship integration automatically syncs your shipping data, giving you access to key fields including **Shipping Cost, Tracking, Shipments, Parcels, Items, Rates, Address**, and a full range of shipping-related metrics — all in one place.
Use this data to build custom reports, monitor shipping costs, track parcel status, analyze carrier rates, and manage delivery performance across any date range. Combine Easyship data with your Shopify order data to get a full picture of your fulfillment operations from purchase to delivery.
**What gets synced:**
* 📦 Shipments & Parcels
* 🚀 Tracking & Delivery Status
* 💰 Shipping Cost & Rates
* 🏠 Address & Destination Details
* 🛍️ Items & Order-Level Data
**Works with:** Report Builder, Scheduled Reports, and CSV/Excel Exports.
### :point\_right:How to Integrate Easy Ship with Report Pundit
**Step 1 — Navigate to the Integrations Page** Use the navigation bar at the top of your Report Pundit dashboard and click on **Integrations**.
**Step 2 — Select Easyship** Scroll through the list of available integrations and click on the **Easyship** tile to open the integration details.\
\
**Step 3 — Connect via API Token** Click the **Connect** button and enter your Easyship API Token to authorize the integration.\
\
**Where to find your API Token** [(Where to find API Token)](https://developers.easyship.com/reference/authentication#how-to-get-an-api-access-token)
1. Log in to your **Easyship account**
2. Go to **Settings** from the left-hand menu
3. Click on **API & Webhooks** (or **API Access**)
4. Copy your **API Token** and paste it into Report Pundit\
\
**After Connecting**
Once integrated, clicking on the Easyship integration widget will display your connection status along with the available metrics and data sync options — including Shipments, Tracking, Shipping Cost, Rates, Parcels, Items, and Address details.\
#### Need a Custom Report?
If you need help creating custom Easyship reports, our support team is happy to assist.
* 💬 **Live Chat** — Available directly within the app
* ✉️ **Email** — Reach out to our support team via email
# Ship Station
### :point\_right:*Steps to integrate ShipStation with Report Pundit*
1\. Navigate to the "**Integrations**" page using the navigation bar at the top.
2\. Select **Ship Station** from the list of integrations.
#### 3. Complete Setup by providing your API credentials.
* Copy the **API Key** and **API Secret** form above setup and paste them into the fields in the Report Pundit Ship Station integration window.
* Click on the **Connect** button to save the credentials.

## How do I obtain my API Key and API secret?
:white\_check\_mark: Go to [**Ship Station**](https://ship13.shipstation.com/settings/api) and log in to your Ship Station account. If you don’t have an account, click Try Ship Station to create your account.

:white\_check\_mark: At the top right, click the Profile icon, then select My Profile & API settings

:white\_check\_mark: Click on "Generate API keys" and you will see the API Key and API secret. Copy and paste it into your Report Pundit Ship Station Integration.
:white\_check\_mark: Click Connect to integrate Report Pundit with Ship Station
Contact our support team through [live chat](https://www.reportpundit.com/contact-us) or [by email](mailto:support@reportpundit.com) for help in creating reports.
# Ship Hero
### :point\_right:***Steps to Integrate your Ship Hero account to Report Pundit***
1. Navigate to the **'Integrations'** page using the navigation bar at the top.
2. Select **Ship Hero** from the list of integrations.

3. Enter the **Username** and **Password.**
4. Click on **'Connect'.**
5. Contact support.
Contact our support team through [live chat](https://www.reportpundit.com/contact-us) or [by email](mailto:support@reportpundit.com).
Let us know which fields you require, and we'll set it up for you.
# Bold
Learn how you can integrate with the Bold app to share data with it.
### :point\_right:Steps to Integrate with Bold
1. Click on the "**Connect**" button.

2. Enter your Bold credentials and authenticate Report Pundit.

#### 3. Contact support.
Contact our support team through [live chat](https://www.reportpundit.com/contact-us) or [by email](mailto:support@reportpundit.com)
Let us know which fields you require, and we'll set it up for you.
# Printful
Printful is a popular Print-on-Demand (POD) service for dropshipping products with custom prints. Merchants can use its app to gather necessary data and make informed decisions about their business.
Printful's custom-printed products can be dropshipped to multiple locations worldwide. It makes international selling simple for Shopify merchants who want a hands-free approach to their business. Connect your Shopify account to Printful and the company will print, package and ship products to your customers with minimal effort from your end.
Integrate Printful with Report Pundit for complete awareness and control of your business on the platform. Report Pundit fetches data you need for in-depth insights and presents it in a neatly packaged, custom report. Grow your Printful business with accurate data-driven decisions.
### :point\_right:How to Integrate Printful with Report Pundit
Here are the steps to integrate:
1. Click on **Integrations** in Report Pundit’s navigation bar.
2. The **Printful** integration option should be visible. If not, scroll until you find it. It is also likely to be found under **Recently Added** and **Shipping** categories on the left.
3. Click on the panel and then on the **Connect** button.
4. Follow the on-screen instructions to Log in to your Printful account and integrate the two apps.
{% hint style="success" %}
Once confirmed, you’re ready to get reports with your Printful data.
{% endhint %}
# Pinterest Ads
**Connect your Pinterest Ads account to Report Pundit and get a complete view of your ad performance right alongside your Shopify store data.**
This Integration automatically syncs your campaign data, giving you access to key metrics including **Impressions, Clicks, CPC, Cost, Spend, Revenue**, and a full range of traffic and engagement signals all in one place.
Use this data to build custom reports, track campaign ROI, monitor ad spend against revenue, and spot trends across any date range. Combine Pinterest metrics with your Shopify sales data to understand exactly how your ads are driving conversions and growth.
**What gets synced:**
* 📊 Impressions & Clicks
* 💰 Cost, Spend & CPC
* 📈 Revenue & ROAS
* 🚦 Traffic & Engagement Metrics
**Works with:** Report Builder, Dashboard Widgets, Scheduled Reports, and CSV/Excel Exports.
### S**teps to Integrate Pinterest with Report Pundit**
**Step 1 — Navigate to the Integrations Page.** Use the navigation bar at the top of your Report Pundit dashboard and click on **Integrations**.\
\
**Step 2 — Select Pinterest** Scroll through the list of available integrations and click on the **Pinterest** tile to open the integration details.\
\
**Step 3 — Connect via OAuth** Click the **Connect** button. You'll be redirected to Pinterest's secure OAuth authorization screen. Log in with your Pinterest Ads account and grant the required permissions. Once approved, you'll be automatically redirected back to Report Pundit.\
\
\
#### After Connecting
Once integrated, clicking on the Pinterest integration widget will display your connection status along with the available metrics and data sync options.
#### Need a Custom Report?
If you need help creating custom Pinterest Ads reports, our support team is happy to assist.
* 💬 **Live Chat** — Available directly within the app
* ✉️ **Email** — Reach out to our support team via email
# Authorize.net
### :clipboard: *Steps to Integrate Authorize.net with Report Pundit*
:heavy\_check\_mark: Navigate to the '**Integrations'** page using the navigation bar at the top. Click on **Authorize.net** from the list of integrations.

:heavy\_check\_mark: Enter your **API Login ID** and **Transaction Key**. Click on **'Connect'.** [**How do I obtain my API Login ID and Transaction Key?**](https://support.authorize.net/s/article/How-do-I-obtain-my-API-Login-ID-and-Transaction-Key)

## How do I obtain my API Login ID and Transaction Key?
1. Log into the [Merchant Interface](https://account.authorize.net/).
2. Click **Account** from the main toolbar.
3. Click **Settings** in the main left-side menu.
4. Click **API Credentials & Keys**.
5. Select **New Transaction Key.**
6. ***Note**: When obtaining a new Transaction Key, you may choose to disable the old Transaction Key by clicking the box titled, **Disable Old Transaction Key Immediately**. You may want to do this if you suspect your previous Transaction Key is being used fraudulently.*
7. Click **Submit** to continue.
8. Request and enter PIN for verification.
9. Your new Transaction Key is displayed.
Contact our support team through [live chat](https://www.reportpundit.com/contact-us) or [by email](mailto:support@reportpundit.com) for help in creating reports.
{% hint style="success" %}
:star2: That's it! You're all done.
{% endhint %}
# Recharge Payments
Recharge simplifies subscription payments for merchants. It offers a flexible platform to manage dynamic recurring billing on web and mobile with built-in taxes, shipping, and discount capabilities.
Report Pundit leverages Recharge Payments' easy app integration to deliver comprehensive reports with your subscription payments data. Track multiple customer subscription payments across payment options. Gain insights into your product pricing strategy, especially your choice of payment options.
### :clipboard: *Steps to integrate Recharge Payments with Report Pundit*
1. Navigate to the **Integrations** page using the navigation bar at the top.

2. Select **Recharge Payments** from the list of integrations.

3\. To complete the integration, enter the **API token.** Then, click on **Connect**.
4\. Let us know which fields you require via [live chat](https://www.reportpundit.com/contact-us) or [by email](mailto:support@reportpundit.com), and we'll set it up for you.
### How to Create an API token?
1. From the Recharge Dashboard, select **Integrations**.
2. Click on **API tokens.**
3. Select **Create an API Token** to generate a new token for your store.

4. Use the **Details** fields to set a name and contact email for the token.
5. Select **Read access** to set scope permissions to the token.
6. Click **Save** to create your token.
# Klarna
Klarna is a fintech company that provides online financial services such as payments for online storefronts and direct payments along with post-purchase payments.
### :clipboard: ***Steps to Integrate your Klarna account to Report Pundit***
:heavy\_check\_mark: Navigate to the **'Integrations'** page using the navigation bar at the top.

:heavy\_check\_mark: Select **Kl*****arna*** from the list of integrations.
:heavy\_check\_mark: Enter the **User name** and **Password.**

**How to acquire Klarna login details (Merchant Id and Secret Key)**
If you don't have Klarna API credentials, you can generate by going to Settings in the Merchant portal.

:heavy\_check\_mark: Once Klarna is connected, Contact our support team through [live chat](https://www.reportpundit.com/contact-us) or [by email](mailto:support@reportpundit.com) to create reports.
{% hint style="success" %}
:star2:Good job! You have successfully integrated your **Klarna** Account to Report Pundit.
{% endhint %}
###
# Shippo
### :clipboard: *Steps to Integrate Shippo with Report Pundit*
:heavy\_check\_mark: Navigate to the '**Integrations'** page using the navigation bar at the top. Click on **Shippo** from the list of integrations.

:heavy\_check\_mark: Enter your **API Token**. Click on **'Connect'.**

#### :heavy\_check\_mark: Contact support.
Contact our support team through [live chat](https://www.reportpundit.com/contact-us) or [by email](mailto:support@reportpundit.com).
Let us know which fields you require, and we shall set it up for you.
### **How can I find the API Token?**
#### **Navigate to the API Page**
The [*API Page*](https://app.goshippo.com/settings/api/) is found by clicking on *Settings* in the left navigation panel of your Shippo dashboard and then click on *API*. Both the Live Tokens and Test Tokens are located here.
#### **Generate a Token**
To generate a Live Token, click on the *Generate Token* button in the Live Tokens section. To generate a Test Token, click on the *Generate Token* button in the Test Tokens section.
The Live Token should be used for most functions in production. The Test Token should be used when you want to test out the API end-to-end and purchase test shipping labels. You'll need to set your carrier accounts to test mode as well. You can reference the [*Test Mode documentation here*](https://goshippo.com/docs/test-mode/).
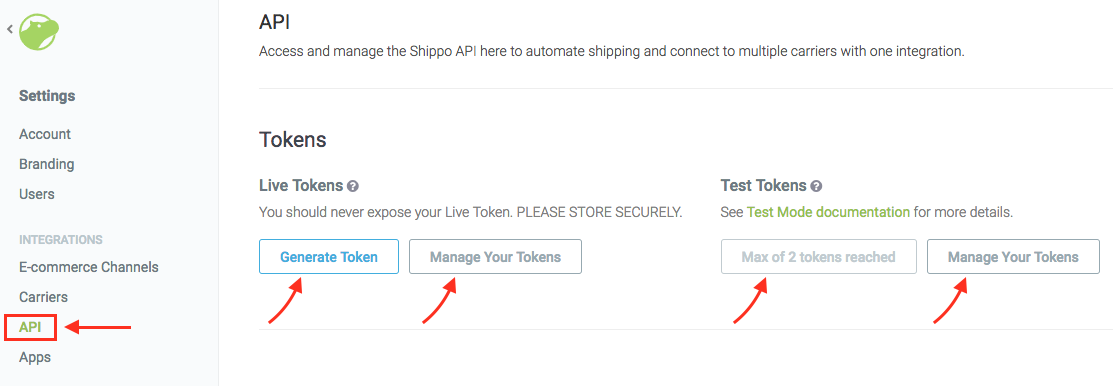
#### **Retrieve a Token**
Tokens are masked in your dashboard for security and cannot be retrieved. You will only be able to view your token one time when you first generate the token. Please make a note of it at that time. If you need a token, you will need to generate a new one using the *Generate Token* button.
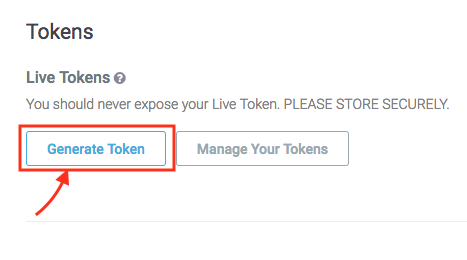
You'll see a pop-up window displaying your token and a message reminding you it is the only time it can be viewed.
{% hint style="success" %}
:star2: That's it! You're all done.
{% endhint %}
# Returnly
### :clipboard: *Steps to integrate Returnly with Report Pundit*
:heavy\_check\_mark: Navigate to the "**Integrations**" page using the navigation bar at the top.
:heavy\_check\_mark: Select Returnly from the list of integrations.
#### :heavy\_check\_mark: Complete Setup by providing your API credentials.
* Copy the **API Key** paste them into the field, in the Returnly integration window. ([**How do I find the API Key?**](https://help.returnly.com/hc/en-us/articles/360047172194)**)**
* Click on the **Connect** button to save the credentials.
#### :heavy\_check\_mark: Contact support.
Contact our support team through [live chat](https://www.reportpundit.com/contact-us) or [by email](mailto:support@reportpundit.com).
Let us know which fields you require, and we shall set it up for you.
####
# Rich Returns
### :clipboard: *Steps to integrate Rich Returns with Report Pundit*
:heavy\_check\_mark: Navigate to the "**Integrations**" page using the navigation bar at the top.
:heavy\_check\_mark: Select **Rich Returns** from the list of integrations.
#### :heavy\_check\_mark: Complete Setup by providing your API credentials.
* Copy the **API Key** paste them into the field, in the **Rich Returns** integration window.
* Click on the **Connect** button to save the credentials.
#### :heavy\_check\_mark: Contact support.
Contact our support team through [live chat](https://www.reportpundit.com/contact-us) or [by email](mailto:support@reportpundit.com).
####
# Seal Subscriptions
Seal Subscriptions is an app that allows Shopify store owners to offer auto-charging or recurring invoice subscriptions to their customers. Here's how it integrates:
To integrate Report Pundit with Seal Subscriptions, follow the steps below:
1\. Go to your Report Pundit app's **Integrations** section.
2\. Look for the **Seal Subscriptions** integration card. It is in the **View All** and **Subscriptions** sections.
3\. Enter your API Token. You can find your API Token [here](https://www.sealsubscriptions.com/articles/merchant-api-documentation#authentication).
4\. Click on **Connect** and follow the on-screen instructions.
Congratulations! Your Report Pundit app is now successfully integrated with Seal Subscriptions.
# Google Ads
Google Ads assists you in comprehending how well your ad campaigns are performing. It gives you valuable insights like CTR, cost per conversion, and conversion value, which are essential for assessing campaign efficiency and profitability.
### :clipboard: **Steps to Integrate Google Ads**
:heavy\_check\_mark: Navigate to the **'Integrations'** page using the navigation bar & select Google Ads.
:heavy\_check\_mark: Select the Google account to be integrated
:heavy\_check\_mark: You'll see a message asking for permission to grant access to Report Pundit. Simply click the "Continue" button to proceed.
:heavy\_check\_mark: Google Ads account has been successfully integrated
Now you can start creating reports. If you have any questions, don't hesitate to ask our team for assistance.
# Stripe
Stripe offers payment processing software and application programming interface for Shopify.
### :clipboard: *Steps to Integrate Stripe with Report Pundit*
:heavy\_check\_mark: Navigate to the '**Integrations'** page using the navigation bar at the top. Click on **Stripe** from the list of integrations.

:heavy\_check\_mark: Enter your Stripe **Account Name** and **Secret Key**. Click on **'Connect'.**

#### :heavy\_check\_mark: Contact support.
Contact our support team through [live chat](https://www.reportpundit.com/contact-us) or [by email](mailto:support@reportpundit.com).
Let us know which fields you require, and we shall set it up for you.
### **Where can you find the Secret Key?**
#### The key can be found in the [**Stripe dashboard**](https://dashboard.stripe.com/login?redirect=/account/apikeys) as shown below.

{% hint style="success" %}
:star2: That's it! You're all done.
{% endhint %}
# Schedules
Enjoy the convenience of automated report delivery with Schedule. With just a few clicks, you can set when, where, and how you want your reports handed over. Choose from multiple file output formats.
## Schedule Frequency
{% content-ref url="/pages/-MWTwZPqHYmZLH7qEEsC" %}
[Hourly](/knowledge-base/schedules/hourly)
{% endcontent-ref %}
{% content-ref url="/pages/-MWTxKtF-6aKdecOxLZF" %}
[Daily](/knowledge-base/schedules/daily)
{% endcontent-ref %}
{% content-ref url="/pages/-MWTwtRNCe4W3O1TQRWQ" %}
[Weekly](/knowledge-base/schedules/weekly)
{% endcontent-ref %}
{% content-ref url="/pages/-MWTwypqbyB\_FbOXLvfS" %}
[Monthly](/knowledge-base/schedules/monthly)
{% endcontent-ref %}
{% hint style="success" %}
:woman\_tipping\_hand: That's it! You're all set to automatically receive your reports the way you want.
{% endhint %}
# How to Schedule in Report Pundit
Report Pundit’s scheduling feature lets you automatically generate and deliver reports in multiple file formats. Whether you want to view reports directly, share them with your team.
### Steps to Schedule a Report
* **Open the Report**
* Go to **My Reports** from the navigation bar.
* Open the folder where your report is saved.
* Click on the report you want to schedule.
* **Access the Schedule Option**
* On the report page, click the **Schedule** button in the top-right corner.
**Alternatively:**
* In the **My Reports** section, locate your report.
* Click the **Auto-Schedule** icon in the **Actions** column.
* This will take you directly to the scheduling settings.
* **Choose the Schedule Type**
* Select how often you want the report to run:
* Hourly
* Daily
* Weekly
* Monthly
* **Set the Schedule Range**
* Define when the schedule should start and (optionally) end.
* **Customize Delivery (Optional)**
* Use **Advanced Options** to fine-tune delivery frequency or timing.
* **Select an Output Format**
* Choose your preferred output option (for example, view-only, downloadable file, or shareable format).
* **Save the Schedule**
* Click **Save** at the bottom of the page to activate the schedule.
***
#### Notes
* The same process can be used to schedule **newly created reports**.
* You can edit or disable scheduled reports at any time from **schedules.**
# Hourly
Schedule the reports to be delivered every hour, every 2 hours or every 4 hours etc.
### :clipboard: ***Steps to Schedule Reports at varied hourly intervals***
1\) **Open** the report that needs to be scheduled and **select** the schedule button.
2\) Select the '**Hourly**' option. Click on **Next**.
3\) Select the **desired hourly frequency**. Click on '**Save and continue**'.
4\) **Optional:** You can also customize the frequency using our **advanced scheduling** options.
5\) Select the **output option**. **Add** or **Integrate** an account if **required**.
6\) Finally, fill in the required fields and select the output file format. Click on '**Save**'\
\ **Basic Schedule**
{% embed url="" %}
**Advanced Schedule**
{% embed url="" %}
{% hint style="success" %}
:star2: Good job! You have successfully scheduled your reports.
{% endhint %}
## :gear: Advanced Scheduling Options
{% content-ref url="/pages/-MYinu02PoxKCMxiBYJ9" %}
[Hourly - N' Number of Days](/knowledge-base/schedules/hourly/hourly-n-number-of-days)
{% endcontent-ref %}
{% content-ref url="/pages/-MYiv9jL-yuSsDm8MzwW" %}
[Hourly - Week to Date](/knowledge-base/schedules/hourly/week-to-date)
{% endcontent-ref %}
{% content-ref url="/pages/-MYiyRMhkEqEUI\_4QTp2" %}
[Hourly - Static Start Date](/knowledge-base/schedules/hourly/static-start-date)
{% endcontent-ref %}
{% content-ref url="/pages/-MYj1ENM8nLk4l-z\_Pbu" %}
[Hourly - Custom Date Range](/knowledge-base/schedules/hourly/custom-date-range)
{% endcontent-ref %}
# Hourly - N' Number of Days
Fetch the data daily for any number of days from 1 to 31. For example, you can generate a report daily for the last 7 days or 10 days, etc.
### :clipboard: *Steps to Schedule Report using the 'N number of days" widget.*
1. **Open** the report that needs to be scheduled and click the **schedule** button.
2. Select the '**Hourly**' option and click on '**Next**'.
3. Click on 'Advanced **options**'.
4. Select the '**N *****number of days"*** option. Click on '**Next**'.

5. Enter **How many previous days you want to include**. Click on '**Next**'.
6. Select the **hourly frequency**. Click on '**Next**'.
7. Select the **output option**. **Add** or **Integrate** an account if required.
8. Finally, **fill** in the required fields and select the output file format. Click on '**Save**'.
{% hint style="success" %}
:star2: Good job! You have successfully scheduled your reports.
{% endhint %}
# Hourly - Week to Date
Fetch the data from Sunday onwards. For example Sunday to Monday, Sunday to Tuesday or Sunday to Wednesday. Here, Sunday remains constant.
### :clipboard: ***Steps to Schedule 'Week to Date' Daily Reports***
1. **Open** the report that needs to be scheduled.
2. Click on the '**Schedule**' button.
3. Select the '**Daily**' option. Click on '**Next**'.
4. Select '**Advanced options**'
5. Select the "***WTD***" widget. Click on '**Next**'.

6. Select the **hourly frequency**. Click '**Next**'
7. Select the **output option.** **Add** or **Integrate** an account if required.
8. Finally, **fill** in the required fields and select the output file format. Click on '**Save**'.
{% hint style="success" %}
:star2: Good job! You have successfully scheduled your reports.
{% endhint %}
# Hourly - Static Start Date
Fetch the data from a static(fixed) date every day. For example, consider the Static Start Date to be May 1, 2021. The report will run from May 1 to May 2, May 1 to May 3, and so on.
### :clipboard: ***Steps to Schedule Reports with a Static(Fixed) Start Date.***
1. **Open** the report that needs to be scheduled and select the **schedule button**.
2. Select the '**Daily**' option. Click '**Next**'.
3. Select '**Advanced options**'.
4. Select the **'Static Start date'** option. Click '**Next**'

5. Select the desired **Static Start Date** and click '**Next**'
6. Select the **hourly frequency** and click '**Next**'
7. Select the **output option**. **Add** or **Integrate** an account if required.
8. Finally, **fill** in the required fields and select the output file format. Click on '**Save**'.
{% hint style="success" %}
:star2: Good job! You have successfully scheduled your reports.
{% endhint %}
# Hourly - Custom Date Range
This type of scheduling will generate the reports based on the custom date range set. The start date and end date keep changing every day.
*For example, consider a date range from May 2 to May 6, the report will be delivered on May 11, and from May 3 to May 7 the report will be delivered on May 12, and so on.*
### :clipboard: ***Steps to Schedule Reports for a Custom Date Range.***
1. **Open** the report that needs to be scheduled and select the **schedule** button.
2. Select the '**Daily**' option. Click '**Next**'.
3. Click on '**Advanced options**'.
4. **Select** the "**Custom Date Range**" option. Click '**Next**'.

5. **Fill** in the **custom date** and **time** ranges according to your requirement. Click '**Next**'
6. Select the **hourly frequency.** Click '**Next**'
7. Select the **output option**. Add or Integrate account if required.
8. Finally, **fill** in the required fields and select the output file format. Click '**Save**'
{% hint style="success" %}
:star2: Good job! You have successfully scheduled your reports.
{% endhint %}
# Daily
Schedule last 24-hours report to be delivered at any specific time of the day.
For example, **if you select 9:00 AM.**
* The report will contain data from **9:00:00 AM** to **8:59:59 AM** of the following day.
* The report will be delivered every day at **9:00 AM**.
### :clipboard: **Steps to Schedule Reports on a daily basis.**
1. **Open** the report that needs to be scheduled and select the **schedule button**.

2. Select the '**Daily**' option. Click on **save** and **continue**.

3. Pick the **Delivery time** for the reports. Click on **'Next'**.
4. Select the **output option**. **Add** or **Integrate** an account(FTP/Google) if required.
5. Finally, **fill** in the required fields and select the **output file format**. Click on '**Save**'.
**Basic Schedule-Daily**
{% embed url="" %}
**Advanced Schedule- Daily**
{% embed url="" %}
{% hint style="success" %}
:star2: Good job! You have successfully scheduled your reports.
{% endhint %}
## :gear: Advanced Scheduling Options
{% content-ref url="/pages/-MX1ygxZxPozvUEskOKF" %}
[Daily - Custom Time Range](/knowledge-base/schedules/daily/custom-time-range)
{% endcontent-ref %}
{% content-ref url="/pages/-MX1oGSUpYW\_9o0TrExT" %}
[Daily - Custom Date Range](/knowledge-base/schedules/daily/custom-date-range)
{% endcontent-ref %}
{% content-ref url="/pages/-MWcpiMrRUMH3\_mUf01Z" %}
[Daily - Static Start Date](/knowledge-base/schedules/daily/static-start-date)
{% endcontent-ref %}
{% content-ref url="/pages/-MWcp8GRD21rcjeq-dol" %}
[Daily - Year to Date](/knowledge-base/schedules/daily/year-to-date)
{% endcontent-ref %}
{% content-ref url="/pages/-MWcoroZnqh1gJvLgBzW" %}
[Daily - Quarter to Date](/knowledge-base/schedules/daily/quarter-to-date)
{% endcontent-ref %}
{% content-ref url="/pages/-MWcoc9heX8NRAeVQlul" %}
[Daily - Month to Date](/knowledge-base/schedules/daily/month-to-date)
{% endcontent-ref %}
{% content-ref url="/pages/-MWU6PKMmzP0VS5qJ\_bj" %}
[Daily - Week to Date](/knowledge-base/schedules/daily/week-to-date)
{% endcontent-ref %}
{% content-ref url="/pages/-MWU05PkDLwbN5PkLcAS" %}
[Daily - N' Number of Days](/knowledge-base/schedules/daily/daily-n-number-of-days)
{% endcontent-ref %}
# Daily - Custom Time Range
The daily schedule report will capture data that is set b/w specific time of the day and deliver at a specific time.
For example, data from 5 am to 10 am will be delivered on the next day at a specific time.
### :clipboard: ***Steps to Schedule Reports Daily for a Custom Time Range***
1. **Open** the report that needs to be **scheduled** and select the **schedule button**.
2. Select the '**Daily**' option. Click '**Next**'
3. Click on '**Advanced Options**'.
4. Select the '**Custom Time Range**' option. Click '**Next**'.

5. **Fill** in the desired time range. Click '**Next**'
6. Pick the **Delivery time** for the reports. Click on '**Next**'.
7. Select the **output option**. **Add** or **Integrate** an account if required.
8. Finally, **fill** in the required fields and select the **output file format**. Click '**Save**'
{% hint style="success" %}
:star2: Good job! You have successfully scheduled your reports.
{% endhint %}
# Daily - Custom Date Range
This type of scheduling will generate the reports based on the custom date range set. The start date and end date keep changing every day.
*For example, consider a date range from May 2 to May 6, the report will be delivered on May 11, and from May 3 to May 7 the report will be delivered on May 12, and so on.*
### :clipboard: ***Steps to Schedule Reports Daily for a Custom Date Range***
1. **Open** the report that needs to be **scheduled** and select the **schedule button**.
2. Select the '**Daily**' option. Click '**Next**'
3. Click on '**Advanced schedule**'.
4. Choose the '**Custom Date Range**' option. Click '**Next**'

5. Fill in the **custom date and time** ranges according to your requirement. Click '**Next**'
6. Pick the **Delivery time** for the reports. Click '**Next**'
7. Choose the **output option**. **Add** or **Integrate** an account if required.
8. Finally, fill in the required fields and select the **output file format**. Click on '**Save**'.
{% hint style="success" %}
:star2: Good job! You have successfully scheduled your reports.
{% endhint %}
# Daily - Static Start Date
Fetch the data from a static(fixed) date every day. For example, consider the Static Start Date to be May 1, 2021. The report will run from May 1 to May 2, May 1 to May 3, and so on.
### :clipboard: ***Steps to Schedule Reports Daily from a Static(fixed) Date***
1. **Open** the report that needs to be scheduled and **select** the schedule button.
2. Select the '**Daily**' option. Click '**Next**'
3. Click on '**Advanced options**'.
4. Choose the '**Static Date**' option. Click on '**Next**'.

5. **Select** the desired **Static Start Date**. Click '**Next**'.
6. **Select** the hourly frequency and click '**Next**'
7. **Choose** the output option. **Add** or **Integrate** an account if required.
8. Finally, **fill** in the **required fields** and **select** the output file **format**. Click on '**Save**'.
{% hint style="success" %}
:star2: Good job! You have successfully scheduled your reports.
{% endhint %}
# Daily - Year to Date
Fetch the data from the first date of the current year to the current date. This action will repeat every day.
### :clipboard: ***Steps to Schedule 'Year to Date' Daily Reports***
1. **Open** the report that needs to be scheduled and select the **schedule button**.
2. **Select** the '**Daily**' option. Click '**Next**'.
3. Select '**Advanced options**'
4. **Choose** the '**YTD**' option. Click '**Next**'

5. **Pick** the **Delivery time** for the reports. Click '**Next**'
6. **Select** the output option. **Add** or **Integrate** an account if required.
7. Finally, **fill** in the required fields and select the output file **format**. Click on '**Save**'.
{% hint style="success" %}
:star2: Good job! You have successfully scheduled your reports.
{% endhint %}
# Daily - Quarter to Date
Fetch the data from the first date of the current quarter to the current date. This action will repeat every day.
### :clipboard: ***Steps to Schedule 'Quarter to Date' Daily Reports***
1. **Open** the report that needs to be scheduled and **select** the **schedule button**.
2. **Select** the '**Daily**' option. Click on '**Next**'.
3. Click on '**Advanced options**'.
4. Choose the '**QTD**' option. Click on '**Next**'.

5. **Pick** the **Delivery time** for the reports. Click '**Next**'.
6. **Select** the output option. **Add** or **Integrate** an account if required.
7. Finally, **fill** in the required fields and select the output file **format**. Click on '**Save**'.
{% hint style="success" %}
:star2: Good job! You have successfully scheduled your reports.
{% endhint %}
# Daily - Month to Date
Fetch the data from the first date of the current month to the current date. This action will repeat every day.
### :clipboard: ***Steps to Schedule 'Month to Date' Daily Reports***
1. **Open** the report that needs to be scheduled and **select** the **schedule button**.
2. Select the '**Daily**' option. Click '**Next**'.
3. Click on '**Advanced options**'.
4. Select the '**MTD**' option. Click '**Next**'.

5. **Pick** the **Delivery time** for the reports. Click '**Next**'
6. **Select** the output option. **Add** or **Integrate** an account if required.
7. Finally, **fill** in the required fields and select the output file **format**. Click '**Save**'.
{% hint style="success" %}
:star2: Good job! You have successfully scheduled your reports.
{% endhint %}
# Daily - Week to Date
Fetch the data from Sunday onwards. For example, Sunday to Monday, Sunday to Tuesday, Sunday to Wednesday. Sunday remains constant.
### :clipboard: ***Steps to Schedule 'Week to Date' Daily Reports***
1. **Open** the report that needs to be scheduled and **select** the **schedule button**.
2. **Select** the '**Daily**' option. Click '**Next**'.
3. **Click** on '**Advanced options**'.
4. **Select** the '**WTD**' option. Click '**Next**'.

5. **Pick** the **Delivery time** for the reports. Click on '**Next**'.
6. **Select** the output option. **Add** or **Integrate** an account if required.
7. Finally, **fill** in the required fields and **select** the output file **format**. Click '**Save**'.
{% hint style="success" %}
:star2: Good job! You have successfully scheduled your reports.
{% endhint %}
# Daily - N' Number of Days
Fetch the data daily for any number of days from 1 to 31. For example, you can generate a report daily for the last 7 days or 10 days, etc.
### :clipboard: *Steps to Schedule Report via "Last 'n' number of days" widget.*
1. **Open** the report that needs to be scheduled and **select** the **schedule button**.
2. **Select** the '**Hourly**' option. Click '**Next**'.
3. **Click** on '**Advanced options**'.
4. **Select** the 'N***' number of days"*** option. Click on '**Next**'.

5. Enter **How many previous days do you want to include**. Click on '**Next**'.
6. **Select** the hourly **frequency**. Click on '**Next**'.
7. **Select** the output option. **Add** or **Integrate** account if required.
8. Finally, **fill** in the required fields and **select** the output file **format**. Click on '**Save**'.
{% hint style="success" %}
:star2: Good job! You have successfully scheduled your reports.
{% endhint %}
# Weekly
Fetch the data of the past 7 days and delivery it on any specific day.
***For example:***
* **If you select “9:00 AM” and “Monday” and “Tuesday”, you will receive 2 reports.**
* The Monday report will contain the last 7 days of data from Monday, 9:00:00 AM to Monday, 8:59:59 AM. The report will be delivered every week on Monday, 9:00 AM.
* The Tuesday report will contain the last 7 days of data from Tuesday, 9:00:00 AM to Tuesday, 8:59:59 AM. The report will be delivered every week on Tuesday, 9:00 AM.
### :clipboard: ***Steps to Schedule Weekly Reports***
1. **Open** the report that needs to be scheduled and **select** the **schedule button**.
2. **Select** the '**Weekly**' option. Click '**Next**'

3. **Pick** the **Delivery Day and time** of the week. **Click** on '**Next**'.
4. **Select** the output option. **Add** or **Integrate** an account if required.
5. Finally, **fill** in the required fields and **select** the output file **format**. Click on '**Save**'.
**Basic Schedule - Weekly**
{% embed url="" %}
**Advanced Schedule - Weekly**
{% embed url="" %}
{% hint style="success" %}
:star2: Good job! You have successfully scheduled your reports.
{% endhint %}
## :gear: Advanced Scheduling Options
{% content-ref url="/pages/-MXq8LcMZoxg1tgY5K5m" %}
[Weekly - Year to Date](/knowledge-base/schedules/weekly/year-to-date)
{% endcontent-ref %}
{% content-ref url="/pages/-MXq2gaZTyOuULpdHzFP" %}
[Weekly - Quarter to Date](/knowledge-base/schedules/weekly/quarter-to-date)
{% endcontent-ref %}
{% content-ref url="/pages/-MXq06xhZoVvOuECjIFi" %}
[Weekly - Month to date](/knowledge-base/schedules/weekly/month-to-date)
{% endcontent-ref %}
{% content-ref url="/pages/-MXBn-7A3ml5VnUhEEz\_" %}
[Weekly - N' Number of Days](/knowledge-base/schedules/weekly/weekly-n-number-of-days)
{% endcontent-ref %}
{% content-ref url="/pages/-MXqD5mMNtvzi64rOo\_r" %}
[Weekly - Static start date](/knowledge-base/schedules/weekly/static-start-date)
{% endcontent-ref %}
{% content-ref url="/pages/-MXqGpJGkXPDnfRC47ue" %}
[Weekly - Custom Date Range](/knowledge-base/schedules/weekly/custom-date-range)
{% endcontent-ref %}
# Weekly - Year to Date
Fetch the data from the first date of the current year to the current date. This action will repeat every week.
### :clipboard: ***Steps to Schedule 'Year to Date' Weekly Reports***
1. **Open** the report that needs to be scheduled and **select** the **schedule button**.
2. **Select** the '**Weekly**' option. Click '**Next**'
3. **Click** on '**Advanced options**'.
4. **Choose** the '**YTD**' option. Click '**Next**'.

5. **Pick** the **Delivery Day and time** of the week. Click on '**Next**'.
6. **Select** the output option. **Add** or **Integrate** an account if required.
7. Finally, **fill** in the required fields and select the output file **format**. Click on '**Save**'.
{% hint style="success" %}
:star2: Good job! You have successfully scheduled your reports.
{% endhint %}
# Weekly - Quarter to Date
Fetch the data from the first date of the current quarter to the current date. This action will repeat every week.
### :clipboard: ***Steps to Schedule 'Quarter to Date' Weekly Reports***
1. **Open** the report that needs to be scheduled and **select** the **schedule button**.
2. **Select** the '**Weekly**' option. Click '**Next**'.
3. **Click** on '**Advanced Options**'.
4. **Choose** the '**QTD**' option. **Click** on '**Next**'.

5. **Pick** the **Delivery time** for the reports. **Click** on '**Next**'.
6. **Select** the output option. **Add** or **Integrate** an account if required.
7. Finally, **fill** in the required fields and **select** the output file **format**. Click on '**Save**'.
{% hint style="success" %}
:star2: Good job! You have successfully scheduled your reports.
{% endhint %}
---
[Next Page](/llms-full.txt/1)