📋Guides
View the latest changes and improvements we've made to Report Pundit to enhance your user experience.
🗓️July 2024
🎉Feature Update
🔛Sync Progress
We've changed how Report Pundit synchronizes your shop data with the app when it's first installed. Experience quicker and more convenient data synchronization to help you get started on your Report Pundit journey without delays.
Here is a glance at the changes:
Sync now progresses in automated batches of data sets instead of the earlier fixed quantity of data sets. The first batch contains the last 7 days of data from date of installation. The proceeding batches have a month's worth of data starting from the end of the previous batch.
The Order and Year thresholds of the data synced depends on your chosen plan:
Basic and Shopify plans will sync the last 2 years / 200,000 order count worth of your data.
Advanced and Plus plans will sync the last 2 years / 400,000 order count worth of your data.
You'll notice a sync indicator button at the bottom left of your Report Pundit account viewer. Clicking on it shows the progress bars for your different data types like Order, Product, Transactions, etc.
Learn more about this update by clicking the tab below:
🗓️July 2024
🌟New Feature
🔢Decimal Format Adjustment
Report Pundit has introduced the decimal format adjustment feature. It’s now possible to manually alter the accuracy of numerical data values in your reports up to two decimal places.
Whether you want to view data like Total Sales in full detail, or just glance at the whole figures, you’re in charge. All it takes is just a few clicks to add or remove your desired number of decimal values.
Here are the steps to change the decimal format
In any report with numerical values, click on Format at the top right.
Go to the Currency section in the Format drop-down menu. You should see the Decimal Format option at the bottom with the central panel showing your current decimal format.
Click on the button on the left of that central panel to reduce the number of decimal places. Click on the button to the right to increase the decimal place count.

The report refreshes every time you change the decimal format. You’ll see the new format applied once the refresh completes.
🗓️July 2024
🌟New Feature
📅Include Current Day Data
Now get today’s data in your reports with Report Pundit’s new Current Day Data feature. Gain complete insights about your store performance instantly by adding current data to reports with “Last 7 Days”, “Last 30 days”, etc. data timelines. By default, your reports have data of the completed business day.
Here are the steps to include current day data:
Click on Settings in the navigation bar.
Click on Report Formatting in the left panel in the Settings page.
In the Report Formatting page, toggle the Include Current Day option to the right to enable it. Or if it's enabled, toggle the switch left to disable.

🗓️July 2024
🌟New Feature
☀️Week Starts from Sunday Option
Report Pundit just became more flexible with the new “Week Start from Sunday” feature. You can set the app to follow a Sunday-to-Saturday weekly schedule instead of the default Monday-to-Saturday one. It’s another way to personalize your favorite Shopify reporting app for store insights that matter to you.
Here are the steps to enable this feature:
Go to Report Pundit’s Settings page in the top navigation bar.
In the left navigation panel, click on Report Formatting.
Locate the toggle switch labeled Week Start from Sunday to the right to enable the option. If you want to disable it, simply toggle it to the left.

🗓️June 2024
🎉Feature Update
💈Add Columns Option Revamp
Managing data columns in your reports just got easier with the new feature update. Here are the list of changes:
Simplified Column Management: No more jumping across sections to manage your data column actions. Rearrange, add, remove, and hide columns in the Add Columns menu.
Enhanced Column Customization: Use the Add Custom Column option in the Add Columns menu to easily add calculated and static fields.
Request Custom Columns: Need a column that's not on the list or having trouble creating a custom column? Simply click on the Request Custom Column link to have our experts do it for you. (Note: This feature is only available to fields under Shopify's "Order", "Product", "Customer", or "Other" categories.)
Refreshed User Interface: The Add Column menu now carries a new UI for enhanced user experience. Identifying and modifying columns is now easier than ever.

Go ahead and explore all that you can do with the new data column customization option. If you have any more doubts you need help with, just contact our support team.
🗓️May 2024
⭐New Feature
🙋Shopify Staff Details Import
Report Pundit can now directly import Shopify store staff details and add them to reports. Make your store staff management a breeze by:
Accurately attributing sales to staff members for easy performance tracking.
Quickly importing staff data automatically without the need for complex configurations and manual data entry.
Here are the steps to add staff details to Report Pundit:
Navigate to Settings in the app's navigation bar.
In the left panel, click on Staff Settings to open the staff details management section.
Click on the Import button to open a pop up box where you can add the details. You can also use an alternate link to that pop up box if there's a notification at the top of the staff settings page with it.
In the import box, click on the Open think page link at the top. It'll take you to a new page with your staff data.
Copy the staff data and paste it in the space provided in the import dialog box.
Click Import at the bottom of the box to complete the process.

That's it! You can now view staff details in reports like "Sales by Staff" to track individual performance and identify top contributors.
🗓️May 2024
⭐New Feature
🔖Bookmarks
Report Pundit now lets you bookmark your desired reports for easy access. Stop losing time searching for the report you want and quickly get to it with this new feature.
Here are the steps to bookmark reports:
👉Method 1: From the Report List in My Reports
Click on My Reports in the navigation bar on top.
Go to your desired report in the list of reports displayed.
Click on the Bookmark icon in the Actions column on the right.
The icon will change color to dark blue indicating that the report is bookmarked.

👉Method 2: From the Report Viewer Screen
Click on My Reports in the navigation bar on top.
Go to your desired report in the list of reports displayed.
Open the report by clicking on the report name or the Edit Report icon
 in the Actions column on the right. This is also called the report viewer screen.
 Click on Options to the right side of the screen. In the drop down menu that follows, click on the Bookmark icon.
The icon will change color to dark blue indicating that the report is bookmarked.

🔍Where to find your Bookmarked Reports
Bookmarked reports can be found in 2 places:
1. In the My Reports section Reports List – You'll find your bookmarked reports in the My Reports section list, with the most recently bookmarked report at the top.

2. In the My Reports section's Favorites folder - Bookmarked reports are automatically saved in the “Favourites” folder in the My Reports folder section.

That's it! You can now get to your desired report in just a few clicks.
🗓️February 2024
⭐New Feature
📏Data Comparison
Report Pundit now offers report data comparison. See how your store fared over any date range up to a year. With a few clicks, check orders received, total sales, and more. Monitor store progress, pinpoint slowdowns, and gather insights for your marketing, product, and strategy improvements. The comparison feature serves as a magnifying glass, helping to assess your Shopify store's competitiveness in detail.
Here are the steps to activate it:
1. Navigate to the report of your choice, or create a new report, containing the Date data column. You can add the Date column if it’s not in the report already.
Note: The Date data field is only available in a limited number of report types.
2. Click on the date range selection tab in the report to reveal selection options.
3. Click on the Show Comparison slider button. The slider background should turn blue, indicating that comparison is now enabled.
4. Select your desired date range. To compare data, choose Previous Period or Previous Year from the drop down menu, and pick the relevant duration. Once done, click on Save.
*Important: You should remove any filter applied for this feature to work.

The app presents a table showing rows of start and end dates for your chosen period, alongside data columns with corresponding values. The specific data columns vary based on the report type.
Click the tab below to learn about this new feature in detail.
Data Comparison🗓️December 2023
🌟New Integration
♾️Loop
Loop is a subscription management tool for Shopify and other eCommerce platforms. Report Pundit now integrates with your Loop account for convenient subscription data viewing.
Keep your Loop subscriber base happy with hassle-free fulfillment by integrating it with Report Pundit. You get deep insights into the automated purchases, delivery schedules and other vital aspects by analyzing the data contained in your custom reports. Cut through the clutter to only see the Loop and Shopify store data you want in reports. Use the data to build better customer subscription and retention strategies.
Here are the steps to integrate:
Click on Integrations in Report Pundit’s navigation bar.
The Loop integration option should be visible. If not, check out the apps list on the page. It can also be found in View all, Recently Added and Subscription on the left.
Click on it. A pop up box asking for your API token will appear. Enter your Loop API token if you have it.
If you don’t have your API token, you’ll have to generate it. Click on the Where to Find Api Token? link in the pop up. You’ll be redirected to the Loop documentation page where you’ll find instructions to generate your API token.
After entering your API token, click on Connect to integrate the apps.

Once confirmed, you’re ready to get reports containing your Loop subscriptions data. 🎉
🗓️October 2023
🌟New Integration
👕Printful
Printful is a popular Print-on-Demand (POD) service provider enabling eCommerce merchants to sell custom printed products via dropshipping. Report Pundit now integrates with your Printful account to fetch data and add it in your custom reports.
With this integration, you can get data on your Printful Orders, Financials, Shipping, Fulfillment, and more.
Here are the steps to integrate:
Click on Integrations in Report Pundit’s navigation bar.
The Printful integration option should be visible. If not, scroll until you find it. It is also likely to be found under Recently Added and Shipping categories on the left.
Click on the panel and then on the Connect button.
Follow the on-screen instructions to Log in to your Printful account and integrate the two apps.

Once confirmed, you’re ready to get reports with your Printful data. 🎉
🗓️September 2023
🌟New Integration
🔆 Amazon Ads
Amazon Ads is the eCommerce giant’s ads solution for businesses. You can run paid ad campaigns, such as Pay-Per-Click (PPC) ads, to grow your brand’s visibility and value. Report Pundit now integrates with Amazon Ads and brings your campaign data on the app to your reports.
Integrate Amazon Ads with Report Pundit to get campaign and performance data directly in your reports. Learn how well your ad campaigns are performing and make crucial data-driven decisions about its strategy, metrics, and more.
Here are the steps to integrate:
Click on Integrations in Report Pundit’s navigation bar.
The Amazon Ads integration option should be visible. If not, scroll until you find it. It can also be found in Recently Added and Marketing on the left.
Click on it and then on the Connect button.
Follow the on-screen instructions to Log in to your Amazon seller account and integrate the two apps.

Once confirmed, you’re ready to get reports containing Amazon Ads data. 🎉
🗓️August 2023
🌟New Integration
😎 TikTok Business
TikTok is a popular social media platform for its short video format content. Its large global user base makes it a great marketing tool for eCommerce sellers. We have now integrated TikTok Business with Report Pundit to help you track user data from the platform and add it to your reports.
This integration lets you learn how effective your TikTok marketing strategy is by studying ad clicks and conversion rates.
Here are the steps to integrate:
Click on Integrations in Report Pundit’s navigation bar.
The TikTok integration option should be visible. If not, scroll until you find it. It is also likely to be found under Recently Added in the left column.
Click on the panel to reveal the Connect button.
Click on the Connect button and follow the on-screen instructions to integrate the two apps.

Your TikTok account is now integrated with Report Pundit. 🎉
🗓️July 2023
🌟New Integration
📺Bing Ads
Bing Ads is Microsoft’s solution for advertising on its Bing search platform. Businesses can increase their brand visibility, traffic, etc. to their site by running SEM campaigns. You can now integrate Bing Ads with your Report Pundit account to get its data in your reports.
With this integration, your reports can display important Bing Ads data about your campaign on the platform. Use it to gain insights on your campaign performance, strategy, related metrics, and more.
Here are the steps to integrate:
Click on Integrations in Report Pundit’s navigation bar.
The Bing Ads integration option should be visible. If not, scroll until you find it. It can also be found in Recently Added and Marketing on the left.
Click on it and then on the Connect button.
Follow the on-screen instructions to Log in to your Microsoft account and integrate the two apps.

Once confirmed, you’re ready to get reports containing Bing Ads data. 🎉
🗓️June 2023
🌟New Feature
👨💼User Addition and Management
You can now add multiple users to your Report Pundit account and manage their access to your reports.
Here is the easy procedure to set it up:
Click on the Settings menu in the navigation panel at the top.

In the Settings menu, click on User Management at the bottom of the options panel on the left.

Create an account by clicking on the Add User tile and entering the Username and Password.


You can create it as an Admin or a regular User account by selecting the respective option.

Once you’ve filled in the details, click on the Create button. Your new account is now ready to go.

You can manage all of your accounts efficiently and easily via the User Management section. Perform tasks like assigning roles, setting passwords, deactivating/deleting accounts, and more as required.
Learn more about this feature in User Management Help documentation.
🗓️ June 2023
🌟 New Features
💪Power BI Export
Power BI is a powerful business intelligence tool that allows you to visualize, analyze, and share data insights. With our latest update, you can easily auto-schedule your reports to be delivered to Power BI in your preferred file format.
Just follow these steps to connect your Power BI and Report Pundit accounts:
Schedule report generation via Report Pundit. (Click here to learn about report scheduling).
Click on Power BI in the Output Options stage of the scheduling process.
Reaching Power BI via My Reports/Custom Reports scheduling process

Reaching Power BI by rescheduling reports via navigation tab's Schedule option.

Click on the Connect with Power BI button. You'll be redirected to Power BI's login page. Follow the on-screen instructions to connect.
That's it! You can begin auto-exporting your Shopify data and unlocking its additional potential.
Click here to learn how to schedule and export your files to Power BI.
🗓️March 2023
🌟New Integration
🚢ShipBob
ShipBob is a handy shipping software that simplifies order fulfillment for merchants. It uses the Agile methodology and is popular for direct-to-customer fulfillments. Report Pundit can now integrate with your ShipBob account directly to bring your data from there to your reports.
By integrating the two apps, you get vital data on many shipping and order fulfillment activities like item picking, packing, receiving, etc. You get an in-depth look at your store's performance and customer satisfaction levels by analyzing this data.
Here are the steps to integrate:
Click on Integrations in Report Pundit’s navigation bar.
The ShipBob integration option should be visible. If not, scroll until you find it. It can also be found under the Recently Added and Shipping categories on the left.
Click on it and then on the Connect button.
Follow the on-screen instructions to Log in to your ShipBob account and integrate the two apps.

Once confirmed, you’re ready to get reports containing your ShipBob data.
📂My Report Folder View
🙄What's the change? and what was the need?
The new feature allows you to segregate your reports and save them collectively as a folder. You can find the switch to the folder view under the My Reports section.
We included this feature to make it easier and handier for you to manage your reports.
👁️🗨️Where can it be seen?
You can see the new switch Folder beside List on the My Reports page.
🤔How to use it?
📁 From the default folder:
By default, all reports will be saved to the Default Folder. To move a report to the desired folder, click on Move and choose the folder.

🛃 For custom reports:
While generating a custom report, you will be asked to choose the desired folder to save the report in.

You cannot delete or rename the default folder.
You cannot delete a folder if it contains reports.
Column Resizing
We have enabled the user to resize the field columns in the app report-table.
Field Functions/Options
We have introduced a dropdown with multiple options in the field header.
Freeze/Unfreeze Columns— Ability to fix(freeze) the fields to the left of the table.
Sort by Ascending Order
Sort by Descending Order
Filter this Column
Rename Field
Remove Field
Clone Field
Hide Field
Freeze/Unfreeze Columns
As mentioned above, the user is enabled to fix(freeze) particular fields to the left of the table.
This option is available in the field header dropdown.
🗓️ March 2022
11 New Integrations Added.
Recharge Payments
Authorize.net
Returnly
Rich Commerce
Affirm
Sezzle
After Pay
Yotpo
UpPromote
Square
Razorpay
🗓️ October 2021
Major Update - Revamped Interface
We have renewed and renovated the application interface.
Here are a few screenshots (Old and New) for your reference.
☑️ Library Page (previously known as 'Reports')


☑️ 'My Reports' section in the library page that contains all your saved reports have been moved to a separate page which can be accessed from the navigation panel at the top.

☑️ Report View


☑️ Sidebar: The section on the left that you see in the Old Report View contains 'Report Type' selector and 'Fields' editor. This section has been moved to the side-bar which has been added in the new design.

🗓️ September 2021
New Integrations Added
We have introduced Integrations with Ship Station, Shippo, ShipHero, Printavo, Snapchat, and Bold Commerce.
🗓️ August 2021
New Integrations Added
We have introduced Integrations with Klarna, Amazon Pay, FedEx, and PayWhirl.
🗓️ July 2021
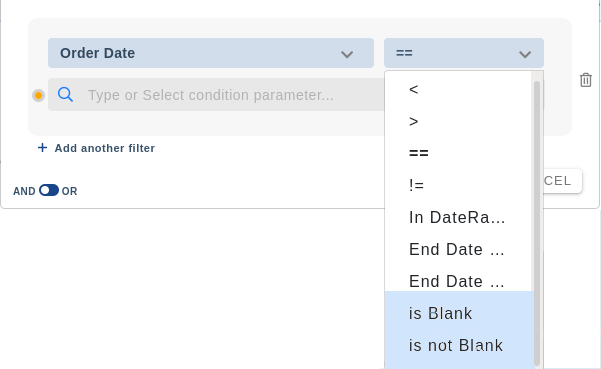
Change in filter name
We have changed "is NULL" and "is NOT NULL" to "is BLANK" and "is NOT BLANK" respectively for better understanding, but their function remain the same.

🗓️ June 2021
Stripe Integration
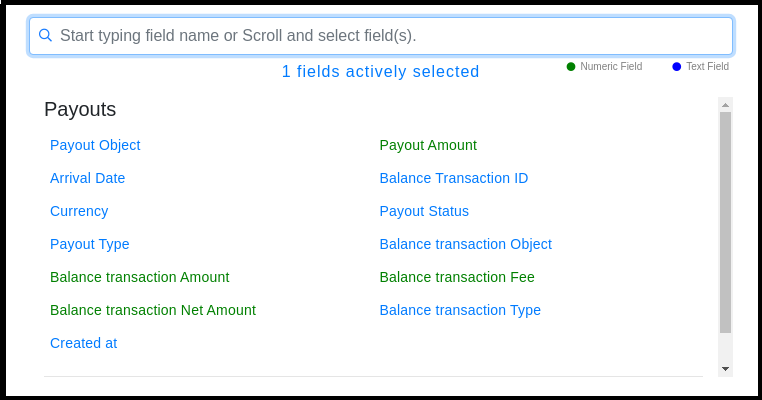
We have now integrated Stripe with Report Pundit. You'll be able to extract specific data from your Stripe account and create reports through our app. We can even connect the Stripe payouts with the orders.
Most commonly used fields of Stripe reports has been shown in the image below.

🗓️ May 2021
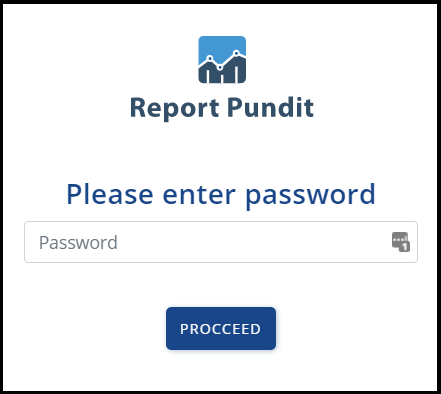
Password Protection
We have enhanced the app security with this new feature, which allows you to set a password for the app.
This restricts the staff to enter the Report Pundit app without the shop owner's permission.

Users can create a password on the Account page, under 'My Password' section.

Once the password is created, the User gets two options, under the same section.

Reset Password - Upon clicking this button, a reset password link is sent to the installer's email address to authenticate and create a new password.
Disable Password - This option clears the password set. Anyone can enter the app without a password
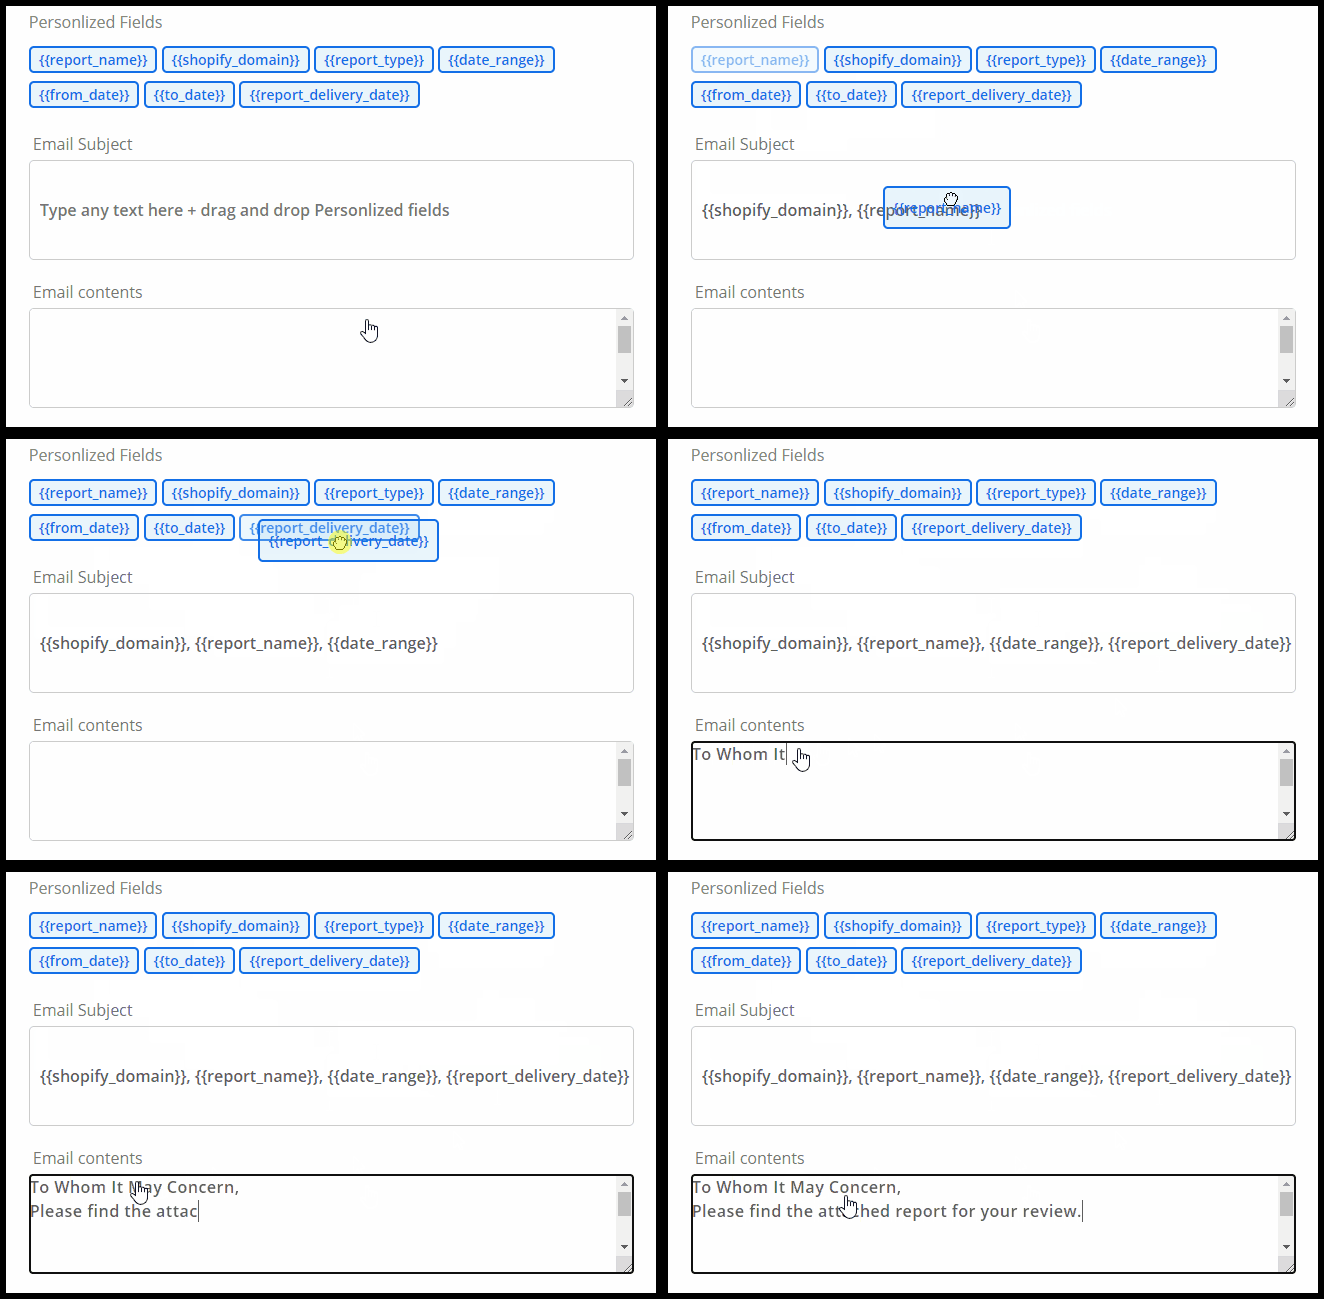
Personalized Fields and Email Subject

This feature belongs to the Email output option, under report scheduling.
Personalized Fields: This new tool makes it convenient to draft the e-mail. You can drag and drop the personalized fields into the Subjects box or the Contents box.
Email Subject: This has been newly added to write a brief subject for the email.
🗓️ March 2021
'Edited Sales' Report Type
Shopify introduced the Order Editing feature a few months ago, which allows merchants to add products/quantity and remove products/quantity.

Edited Sales Report reflects all the changes/edits that are made to the records of your Shopify store.
For example,
If we create a report, opting 'Sales' or 'Order' as the report type, then the changes made in the orders will not be reflected in the report.
🗓️ October 2020
Whereas, when we select 'Edited Sales' as the report type the edits will be reflected in the report.
🆕 Google Analytics Integration
Google Analytics 4Connected Google Analytics with Report Pundit e-commerce reporting features. Enhanced customer journey report features within Report Pundit app.
🧩 Paypal Integration
Connected Paypal with Report Pundit e-commerce reporting features. Added new transactional reports within Report Pundit.
🧩 Facebook Integration
Connected Facebook with Report Pundit e-commerce reporting features. Added new customer journey reports within Report Pundit.
⚙️ Export Reports to PDF
Exporting the reportEnabled ability for customers to export reports using Adobe Acrobat PDF format.
Schedule Reports to Big Query(Beta)
BigQuerySharing Report Links
Sharing Report LinksAdvanced Schedule Option
Last updated